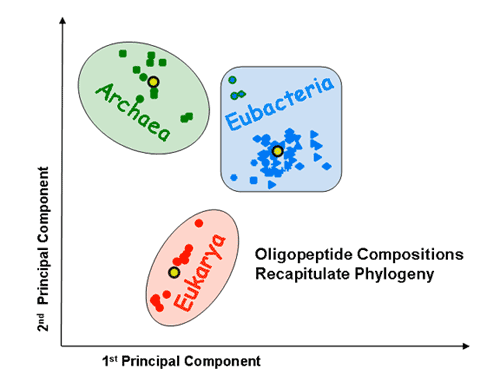
Over 100 genomes have been fully sequenced to date, providing an opportunity for comprehensive comparison and analysis of their organization, similarity, uniqueness and variability at the sequence level. Comparative analysis of the proteomes derived from these genomes has already proven powerful in gene identification, in prediction of structure, function and active sites of proteins, as well as in phylogenetic analysis.
We employed alignment-free system-level methods for examination of evolutionary differences at the molecular level by comparing amino acid or oligopeptide compositions of known proteomes. The underlying hypothesis is that closely related proteomes will tend also to resemble each other at the basic compositional level. Our methodology utilizes the powerful tool of Principal Component Analysis (PCA), a multivariate analysis method. Although previous studies have utilized this approach, we improve analysis of residue composition by focusing on discriminative proteomic features extracted from rationally selected sets of proteomes (training sets). This selection avoids overrepresentation of prokaryotes (due to their overabundance in genome sequence databases), which, to date, has hampered compositional characterization of the eukaryotic super-kingdom by an unsupervised (blind) learning method. Our data demonstrate that not only amino acid composition, but also oligopeptide frequencies, recapitulate phylogeny, i.e. reflect independent segregation between species and phyla.

Proteomic signatures: Principal component analysis (PCA) shows that the three superkingdoms segregate from each on the basis of mono-, di- and tripeptide compositions. The tripeptide PCA pattern is shown.
The x and y axes represent, respectively, the first and second principal components obtained by PCA of the 20-dimensional amino acid composition space of a species training set. The various factorial planes were obtained by using different training sets (A – unsupervised classification; B – supervised classification). Species not used for training are also projected onto the same factorial plane. Species are colored according to the superkingdom they belong to: red for eukaryotes, blue for eubacteria, and green for archaea. Different shapes are used to distinguish between different eubacterial and archaeal subphyla. The three thermophilic eubacteria are indicated by blue shapes with a green border. Yellow circles indicate the average amino acid compositions of the three superkingdoms. The borders around the yellow circles indicate which superkingdom they represent. The training set is highlighted by an increased size of symbols and a black border around them. The percentage contribution of a given component to the overall variability within the training set is indicated on its axis. A. Seventy-two species are projected onto the factorial plane created by using a training set of five eukaryotes, five eubacteria and five archaea. It is of note that the separation between the superkingdoms is robust to the choice of training set. A’. A magnification of the factorial plane is shown around the eukaryotes. Pink circles represent the chromosomes of S. cerevisiae. Dark and light grey circles represent randomly picked sets of 100 and 1000 human proteins, respectively. B. Seventy-two species are projected onto the factorial plane created by PCA analysis with the average protein compositions of the three superkingdoms as a training set (supervised set).

Average amino acid compositions across superkingdoms
Amino acid percentage counts were recorded for 72 species. Bars represent average amino acid frequency for all our eukaryotic (red), eubacterial (blue) and archaeal (green) proteomic datasets. Error bars represent the empirical standard deviation of the recorded percentage counts in each of the three superkingdom-specific datasets. Amino acids that are significantly more frequent in one superkingdom are colored in the color corresponding to this superkingdom.


Projection of the amino-acid frequency vectors of species onto the factorial plane formed by the first two principal components.
The overabundance of each dipeptide in each proteome was computed on a per-sequence basis, taking into account observed single-residue frequencies.The x and y axes represent, respectively, the first and second principal components obtained by principal component analysis of the 400-dimensional space of dipeptide composition. All species in the data set are projected onto the factorial plane that is defined by the compositional averages of the three superkingdoms. Plotted symbols are as in the previous figure.

Projection of the dipeptide overabundance vectors of species onto the factorial plane formed by the first two principal components.
The overabundance of each tripeptide in each proteome was computed on a per-sequence basis, taking into account observed dipeptide. The x and y axes represent, respectively, the first and second principal components obtained by principal component analysis of the 8000-dimensional space of tripeptide composition. Seventy-two species are projected onto the factorial plane defined by the compositional averages of the three superkingdoms. Symbols are as in Fig 3.

Projection of the tripeptide frequency vectors of species onto the factorial plane formed by the first two principal components.
PCA of species tripeptide compositions yields coordinate systems that capture all of the variation within the training set made up of the average compositions of the three superkingdoms. The contributions of the individual tripeptides to the first (x-axis) and second (y-axis) axes of these coordinate systems are plotted. Homotripeptides are plotted in red, palindromic tripeptides in green and other heterotripeptides in blue.

: Tripeptide contribution to principal components of species compositions.
PCA of species tripeptide compositions yields coordinate systems that capture all of the variation within the training set made up of the average compositions of the three superkingdoms. The contributions of the individual tripeptides to the first (x-axis) and second (y-axis) axes of these coordinate systems are plotted. Homotripeptides are plotted in red, palindromic tripeptides in green and other heterotripeptides in blue.


Homo- vs. heterotripeptide contribution to principal components of species compositions.
Principal components were computed for homotripeptide frequencies relative to one another (A) as well as for relative heterotripeptide frequencies (B). Average superkingdom compositions served as a training set. As in previous figures, species are plotted according to the two principal components in the respective analyses.

Species similarity tree based upon amino acid compositions.
The tree was obtained by hierarchical clustering. Species are denoted by their three-letter acronym and phyla by a characteristic symbol. Note that this clustering method may result in negative-length branches.


