

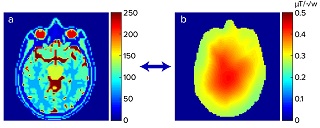
From electrical properties in the brain to the RF
electromagnetic field distribution. a) Electrical properties
in the brain (slice for example, χr = εr – complex permittivity,
including components of conductivity, σ, and relative
permittivity, εr). b) Resulting RF field map.
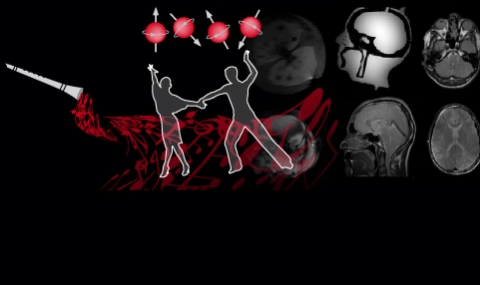
Developing electrical properties mapping as a new means for structural and functional MRI
It can be shown by the Maxwell equations that a local change in electrical conductivity will result in a local phase change of the RF magnetic field. Figure below shows a simulated example of a 10% change in conductivity in visual area. The resulting phase change can be measured using a refocused magnetization (i.e., spin-echo) experiment, which cancels the phase changes due to static magnetic field (B0), and susceptibility, leaving only the RF phase component.
Our research focuses on developing and establishing new ways to probe brain function based on electrical properties, combining it with high temporal and spatial resolution imaging methods. We examine these developments in basic fMRI paradigms collecting human volunteer imaging studies. We explore and separate different sources that can contribute to the changes measured in the electrical properties during functional activation. Such changes include structural or local volumetric changes, blood volume/flow-related effects and ionic concentration changes.
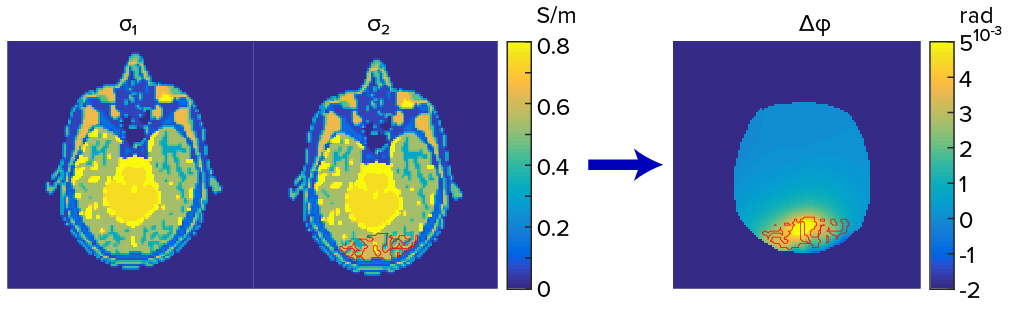
EM simulation of a local change in the electrical conductivity. From left to right - conductivity before (σ1) and after (σ2) the change and the deviation in the respective RF phase maps (Δϕ).
1. Haacke, E. M., Petropoulos, L. S., Nilges, E. W., & Wu, D. H. (1991). Extraction of conductivity and permittivity using magnetic resonance imaging. Physics in medicine and biology, 36(6), 723.
2. Katscher, U., Kim, D. H., & Seo, J. K. (2013). Recent progress and future challenges in MR electric properties tomography. Computational and mathematical methods in medicine, 2013.
3. Hancu, I., Roberts, J. C., Bulumulla, S., & Lee, S. K. (2015). On conductivity, permittivity, apparent diffusion coefficient, and their usefulness as cancer markers at MRI frequencies. Magnetic resonance in medicine, 73(5), 2025-2029.