

One of our main research interests is studying the effect of atomic defects in 2D systems. The defects act as structural perturbations and break the system symmetry by charge localization. Such localization leads to flat electron and hole bands in k-space, which vary the low-energy excitonic transitions and allow a highly controllable exciton nature and lifetime, depending on defect type. We recently studied defect effects on exciton transitions and valley selectivity in monolayer transition metal dichalcogenides (TMDs), using the GW-BSE approach (Refaely-Abramson et al., PRL 121 (2018)). We further explored (Amit et al., PRB 106 (2022)) how defect state localization induces changes in spin polarization, resulting in vanishing g-factors in defect-localized excitations. In collaboration with TU Munich, we explored the effect of these local excitations on defect emission Mitterreiter et al., Nature Commun. 12 (2021)) and magnetic (Hötger et al., npj 2D 7 (2023)) properties.
We recently also studied how interface defects influence excited states in photocatalytic systems (Steinitz-Eliyahu et al., PRM 6 (2022)), as well as the role of defects in electron transport accross TMD-graphene interfaces (Hernangómez-Pérez et al. PRB 2107 (2023)) and their implications in optical absorption (Hernangómez-Pérez et al. Nano Lett. 23 (2023)).
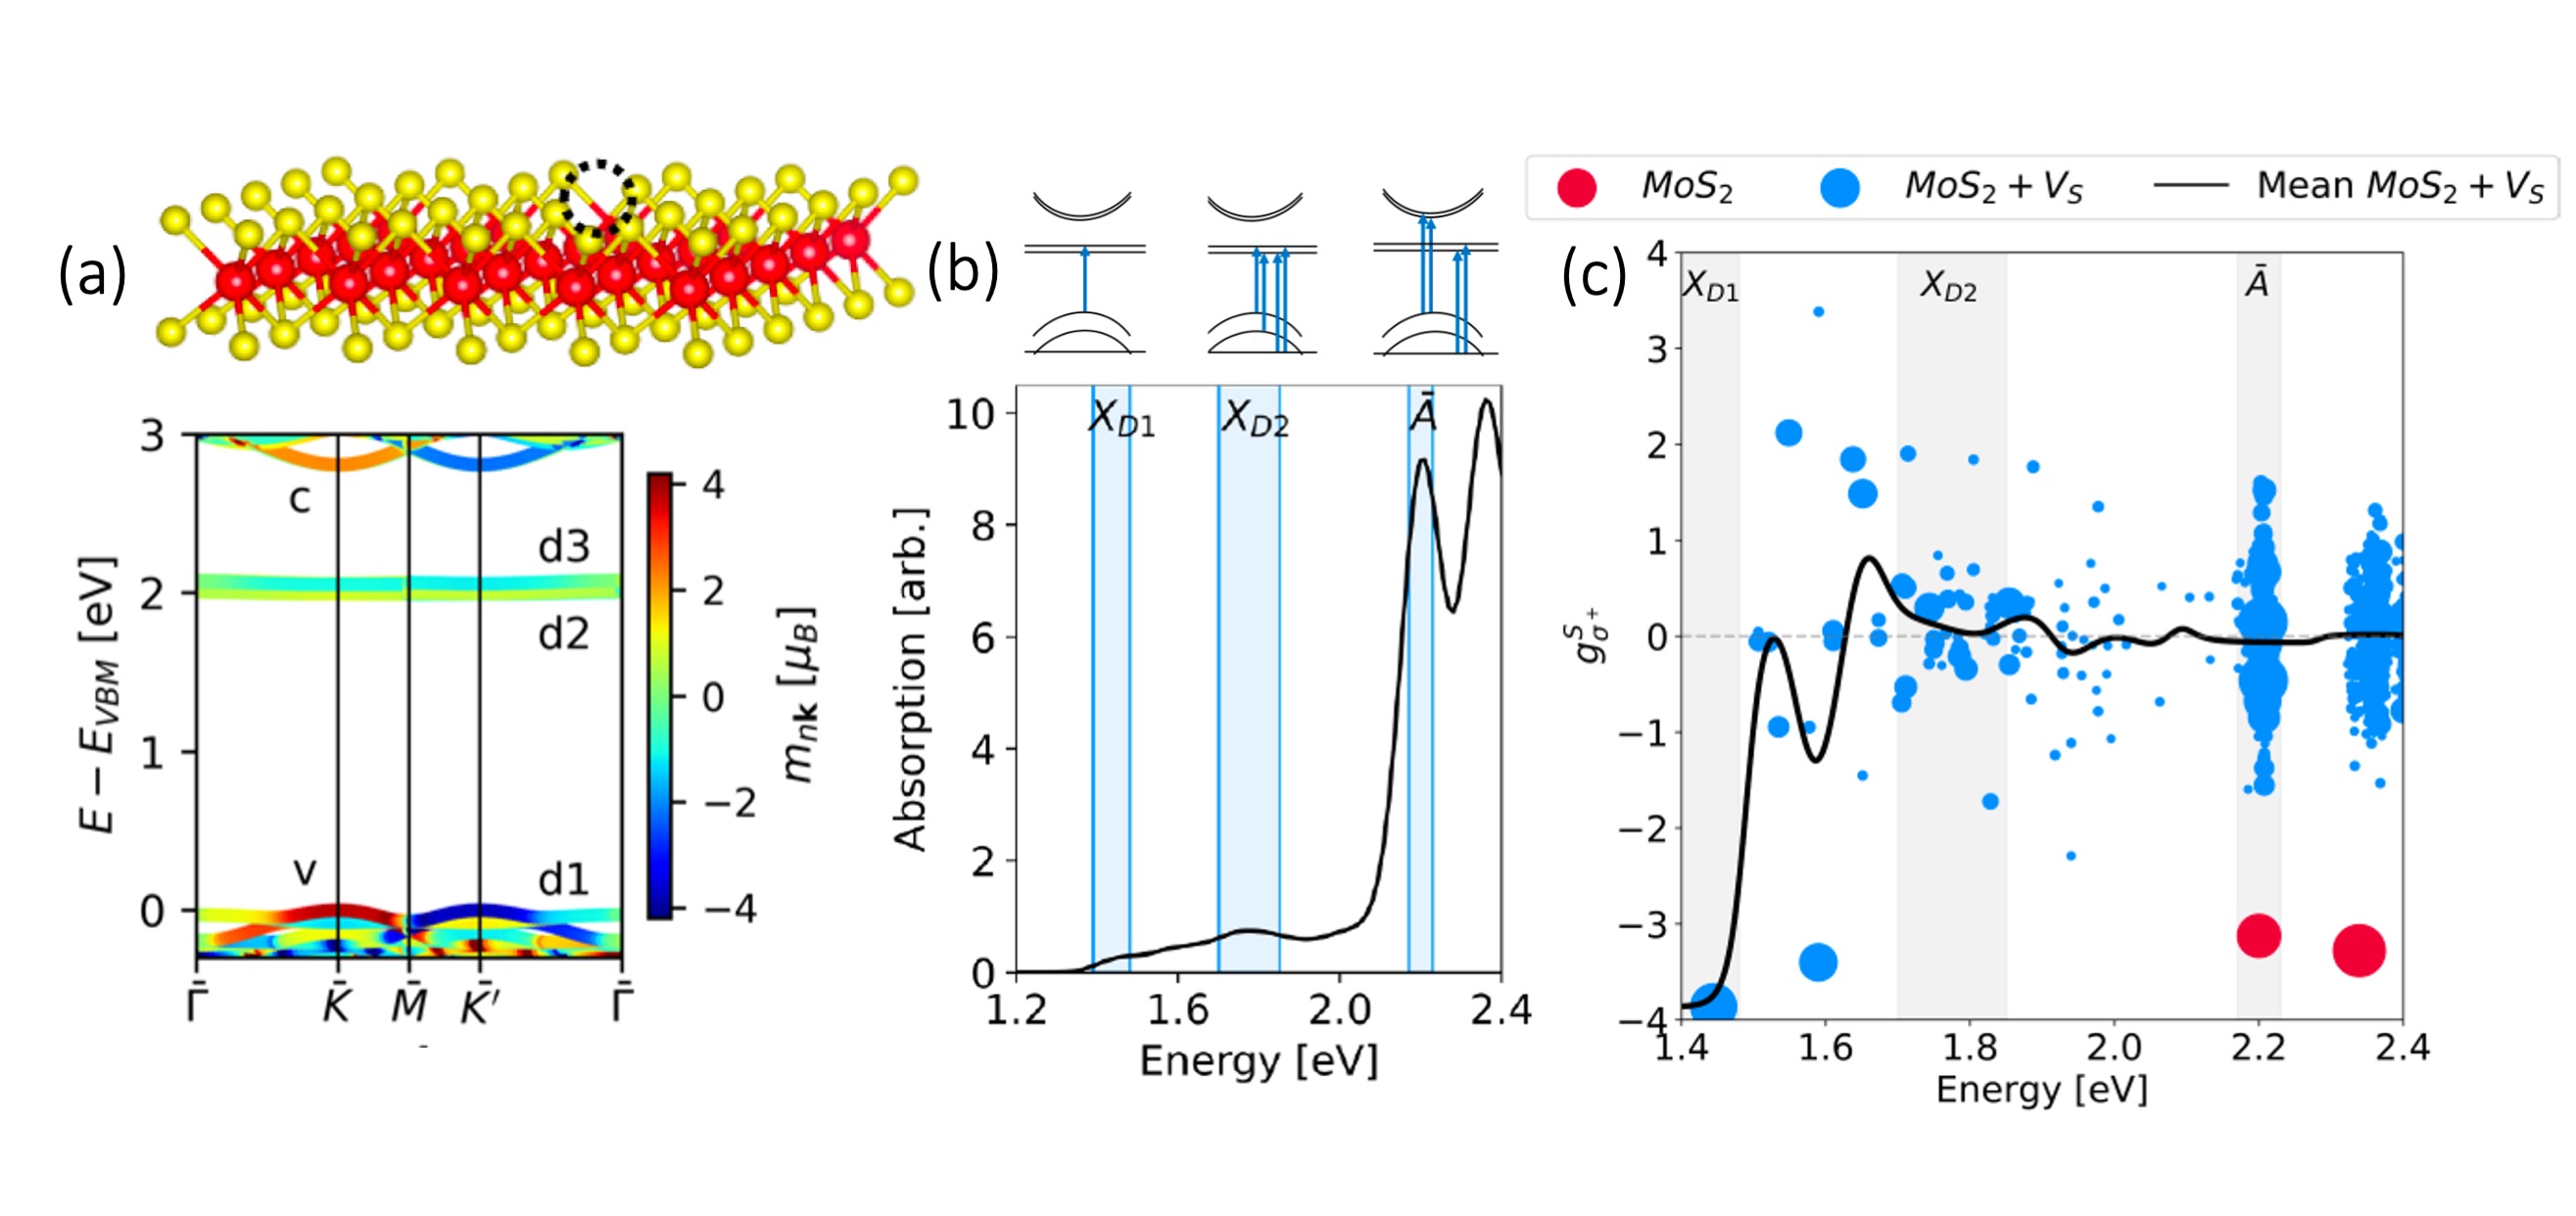
(a) The studied system of monolayer MoS2 with a single sulfur vacancy in a 5x5 periodic supercell, and the calculated quasiparticle bandstructure of the examined MoS2 monolayer with sulfur vacancies. Colors represent the band net magnetic moment mnk (in Bohr’s magneton). (b) Calculated GW-BSE absorption spectrum. The energy regions associated with the three broad exciton features analyzed in this work are highlighted in blue:The A-like peak and two main low-energy defect-induced peaks XD1 and XD2. (c) Calculated exciton g-factors as a function of exciton energy. Dot size is proportional to the computed oscillator strength at the σ+ polarization direction. Red dots show the resulting gfactors for the pristine MoS2. Blue dots show the exciton g-factors in MoS2 with sulfur vacancies. The black line shows the mean g-factor, averaging over the calculated exciton g-factors in the defect-containing system. Taken from Amit et al., PRB 106 (2022).