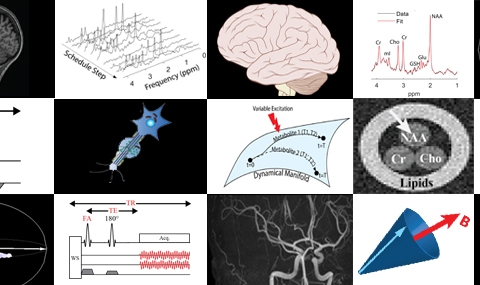
VDI (Visual Display Interface) is a set of MATLAB libraries meant for the visualization, preprocessing, fitting and quantification of multiresolution neuroimaging data, with an emphasis on Magnetic Resonance Spectroscopy (MRS) and Spectroscopic Imaging (MRSI). Some of the things it can do:
- Preprocess single voxel MRS datasets, including spectral phasing, registration, coil combination, and Fourier transforms.
- Interact with LCModel from within MATLAB for seamless fitting of MRS data.
- Carry out quantum mechanical simulations of MRS coupled spin systems and produce detailed basis sets for spectral fitting.
- Calculate fraction of WM, GM or CSF in each MRSI voxel and carry out linear regression to get global GM, WM concentrations.
- Calculate the time course of a BOLD signal inside an MRS voxel.
- Apply a spatial mask to an MRSI dataset to zero out voxels in particular regions of interest, or calculate an average MRSI spectrum by summing all voxels inside a given region of interest defined by a high resolution binary mask (e.g.: the average MRS spectrum from the dorsal anterior cingulate cortex).
To use, simply download, unzip, and add the directory and all subdirectories to the MATLAB path. Consult the README.TXT file in the root directory for an overview of the library and its capabilities:
VDI v1.0.0 (Aug 27, 2023)
An additional directory with example scripts and data can be downloaded from this link (warning: large-ish file, approximately 500 megabytes):
How to Acknowledge: A publication is expected soon, with a more complete overview of the library and its capabilities. Until then, please cite the original paper where software development started out:
A Tal, II Kirov, RI Grossman, O Gonen, The role of gray and white matter segmentation in quantitative proton MR spectroscopic imaging, NMR in Biomedicine (2012)


