
Our previous studies using Hall probes [1-3] have shown that vortex shaking by in-plane ac field can equilibrate very efficiently the vortex lattice at low temperatures, thus allowing study of thermodynamic vortex matter phase diagram. In the current study we combined vortex shaking with differential magneto-optic microscopy in order to visualize the coexistence and propagation of the different phases and phase transitions in underdoped Bi2Sr2CaCu2O8 (ud-BSCCO).
ud-BSCCO samples are characterized by relatively low maximal melting fields, which are accessible to our DMO setup. Subsequently, the melting, inverse melting and glass transitions could be imaged, and the magnetic induction could be methodically mapped in the four phases separated by these transition lines.
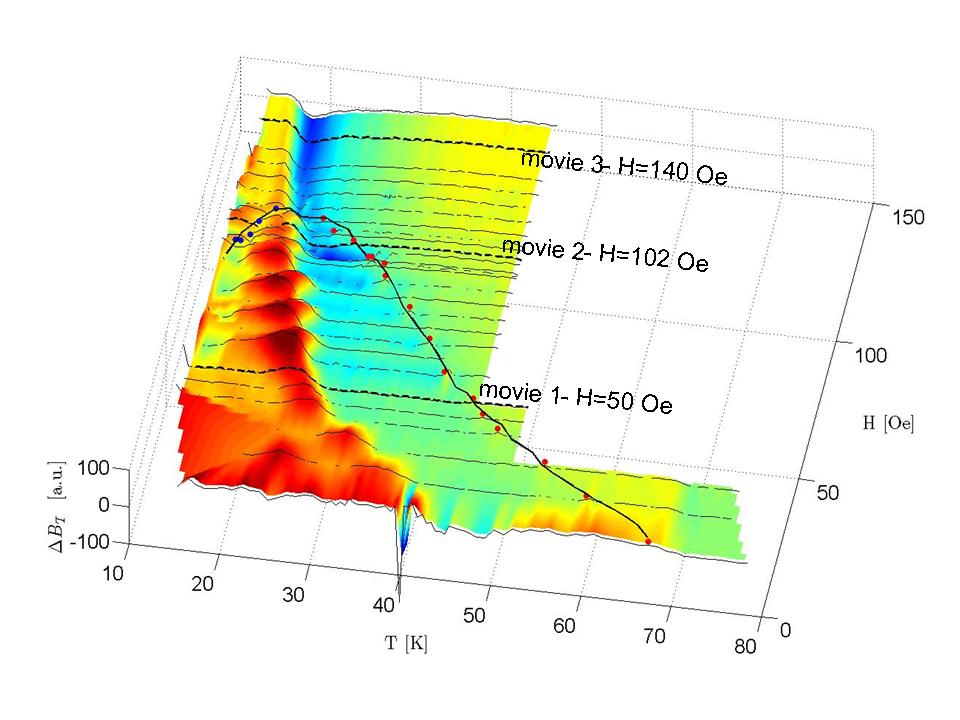
Figure 1: The temperature modulated, differential MO signal, ΔB, averaged over a small region of interest in the sample as a function of the applied field and temperature. The almost vertical line where there is a sharp drop in ΔB (yellow to blue at high fields, and red to green at low fields), is the glass transition line. The full circles mark the first-order transition and the full line connecting them is a guide to the eye. The dashed lines are temperature sweeps that correspond to the movies on this page.
The phase diagram of one of ud-BSCCO crystals is seen in Fig. 1. The figure shows the differential MO signal using temperature modulation, which is equivalent to the derivative of the local induction dB/dT, averaged over a small region of interest inside the sample. The dominant feature in the plot is the glass line, which is seen as a steep line, Hg(T), accompanied by a sharp change in the measured signal (transition from red to green at low fields and from yellow to blue at high fields). At low fields, the glass transition is preceded by a maximum of ΔB(T) (red ridge). The first order transition, which is marked by full circles (red for the melting and blue for the inverse melting), is much lessnoticeable in this plot and the transition points have to be extracted from the DMO images as shown below. The DMO imaging also provides spatial information on disorder and correlations in the vicinity of the phase transitions. Since the crystal is not perfectly homogenous and the geometry of the sample induces uneven B profile, phase transitions nucleate in some region of the sample and the transition propagates throughout the sample as the temperature or field are swept. The shape of the phase transition front, as it propagates across the sample is determined by the induction profile, defects, surface-tension between the different phases, correlation lengths, and the order of the transition.
Figure 2 exemplifies the difference in the pattern structures and their propagation at the three transitions. The top row shows the first-order melting transition. The melting front appears bright against a dark background due to the discontinuous increase in vortex density, as the temperature is increased across the transition [4]. As can be seen in these images, the melting nucleates on growth defects (long, vertical, arc shaped defects), that have slightly different material content and hence different Tc and Bm(T) dependence. The low solid-liquid surface tension, allows for a nucleation of very small droplets and long and narrow melting puddles on the defects. The disorder-driven, first-order, `inverse melting' transition (middle row) displays a dark melting front due to the discontinuous decrease in vortex density as the temperature is increased across the transition. The melting front approximately follows the sample perimeter and shrinks towards the sample center as the temperature is increased. The single, round, melting region suggests longer correlation lengths and a high surface tension, which is oblivious to the growth defects that so much affect the high-temperature melting transition.
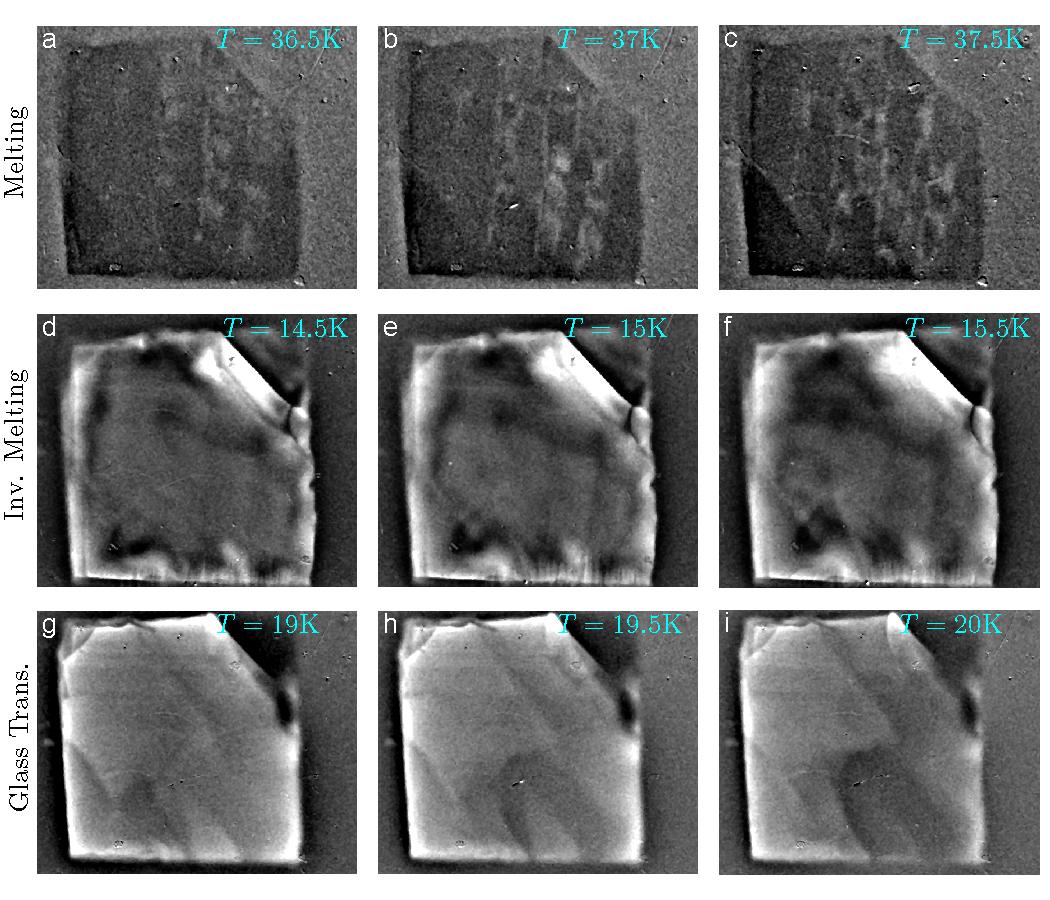
Figure 2: Temperature modulated DMO images of the phase transitions and their propagation. (a)-(c). The first-order melting transition. The melting fronts are the bright, vertically elongated, regions. (d)-(f). The first-order inverse melting, whose front is dark and follows the sample perimeter. (g)-(i). The glass transition that is characterized by large regions in the sample that sharply change their contrast, from being bright to dark (positive dB/dT to negative), as seen for example in the bottom right part of the images.
The glass line is a second-order transition at which correlation lengths are supposed to diverge with no coexistence of the two phases. Indeed, at the glass transition (bottom row of Fig. 2), we do not observe any front propagation. As seen for example in the bottom right area of the figures, instead we find large areas in the crystal which change contrast as a whole (going from positive dB/dT to negative as the temperature increases). The straight perimeter of these areas suggests that these are probably homogenous crystallites which compose the large superconductor.
The three movies below, are temperature scans at fixed applied fields, and correspond to the three dashed lines in Fig. 1. All three movies show the glass transition. Movie 1, which is taken at H = 50 Oe also shows the melting transition, and movie 2, taken at H = 102 Oe, shows all three transitions.
Additional information
- 'Inverse' melting of a vortex lattice
Nurit Avraham, Boris Khaykovich, Yuri Myasoedov, Michael Rappaport, Hadas Shtrikman, Dima E. Feldman, Tsuyoshi Tamegai, Peter H. Kes, Ming Li, Marcin Konczykowski, Kees van der Beek and Eli Zeldov
Nature 411, 451 (2001). - Equilibrium first-order melting and second-order glass transitions of the vortex matter in Bi2Sr2CaCu2O8
H. Beidenkopf, N. Avraham, Y. Myasoedov, H. Shtrikman, E. Zeldov, B. Rosenstein, E. H. Brandt, and T. Tamegai
Phys. Rev. Lett. 95, 257004 (2005). - Interplay of anisotropy and disorder in the doping-dependent melting and glass transitions of vortices in Bi2Sr2CaCu2O8+δ
H. Beidenkopf, T. Verdene, Y. Myasoedov, H. Shtrikman, E. Zeldov, B. Rosenstein, D. Li, and T. Tamegai
Phys. Rev. Lett. 98, 167004 (2007). - Temperature Variations of the Disorder-Induced Vortex-Lattice-Melting Landscape
A. Soibel, Y. Myasoedov, M. L. Rappaport, T. Tamegai, S. S. Banerjee, and E. Zeldov
Phys. Rev. Lett. 87, 167001 (2001).