

A topic of general and wide spread interest in condensed matter physics is the study of phase transitions in the presence of disorder. One such first-order phase transition, which has been widely investigated, is the phenomenon of the melting of the vortex lattice in the presence of disorder. Disorder can be naturally present in the samples due to impurities, crystalline defects, etc., or can be artificially introduced via various irradiation methods.
Though a good deal is known about the mean-field behavior of the melting line, very little is known about the local fluctuations and the factors that determine the local properties of this phase transition. Using the differential magneto-optical imaging technique we have studied the behavior of the local fluctuations in the vortex-lattice-melting transition across HTS single crystals of Bi2Sr2CaCu2O8 (BSCCO).
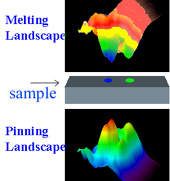
Schematic visualization of the underlying pinning potential (bottom) and melting landscape (top) in a superconductor. Blue represents lower melting temperature while red represents higher melting temperature.
The underlying pinning potential in any superconductor is nonuniform comprising of peaks and valleys (see pinning landscape in the above schematic figure). Regions that have stronger point disorder may have a depressed melting temperature as compared to regions that have weaker pinning (see melting landscape in adjoining schematic, blue represents lower melting temperature while red represents higher melting temperature).
On the other hand, correlated disorder or changes in local anisotropy may increase the local melting temperature. Due to the non-uniform disorder all regions in the sample do not melt simultaneously (for example in the schematic, the region marked as blue melts before the region marked green). Such non-uniform melting gives rise to a complex coexistence of solid and liquid regions across the sample, which reflects the underlying local fluctuations of disorder in the sample.
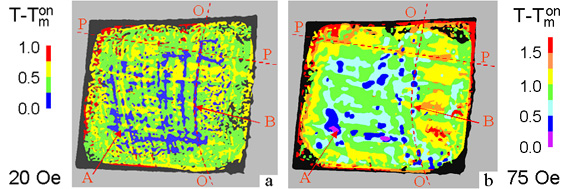
Vortex lattice melting landscape in a BSCCO crystal of 1x1x0.05 mm3. Measurement were done at 20 Oe (panel a) and 75 Oe (panel b), and the color code indicates the expansion of the liquid phase as the temperature is increased in 0.25 K steps.
changes in the vortex-lattice-melting landscape
Using differential magneto-optical technique, we have imaged and measured the changes in the vortex-lattice-melting landscape at different fields and temperatures along the melting line. The differential magneto-optical images were obtained by modulating the temperature by 0.25 K (for details refer to the papers below). Shown in the adjoining figure are the melting landscapes measured at 20 Oe and 75 Oe in a BSCCO crystal of 1 x 1 x 0.05 mm3. The color code indicates the expansion of the liquid phase as the temperature is increased in 0.25 K steps.
Surprisingly, we find a major difference in the melting landscapes at 20 Oe and 75 Oe, and moreover, some of the local minima of the melting landscape change into local maxima and vice versa. We have studied this complex crossover in the melting landscape as one goes from low fields (20 Oe and below) to higher fields (75 Oe and above) along the melting line on the B-T phase diagram. We conclude that this unusual behavior is a result of competing contributions of different types of quenched random disorder, which have opposite effects on the local melting transition.
Additional information
- Temperature Variations of the Disorder - Induced Vortex - Lattice - Melting Landscape
A. Soibel, Y. Myasoedov, M. L. Rappaport, T. Tamegai, S. S. Banerjee, and E. Zeldov
Phys. Rev. Lett. 87, 167001 (2001)..