
Ok, suppose you submitted your job. Now you probably want to either submit a new one, or get some data back from the server. Useful information can be, for example - resource monitoring, and job monitoring. This section will help you understand what are the "frequently asked questions" you might want ask, and how to get answers for them. We will do so by showing the "common" use of several commands that can provide us with the required information. Several switches and options will be explained, but not all of them. As is common with standardized packages a complete list of options and command switches is found in each command's man page and in the user guide as usual. Let's start …
qstat
The central command that gives us the information about jobs and their queues is 'qstat'. Typing 'qstat' will just flush the list of the jobs that are in a system, either running or waiting. Not all of the information generated is intended for human eyes to interpret. Let's present some commonly used switches:
qstat -u $USER

Will list only your jobs. Since PBS Professional was developed decades ago the default number of columns used to present the data is very small, use '-wa' switch to enjoy your wide screen:
qstat -wau $USER
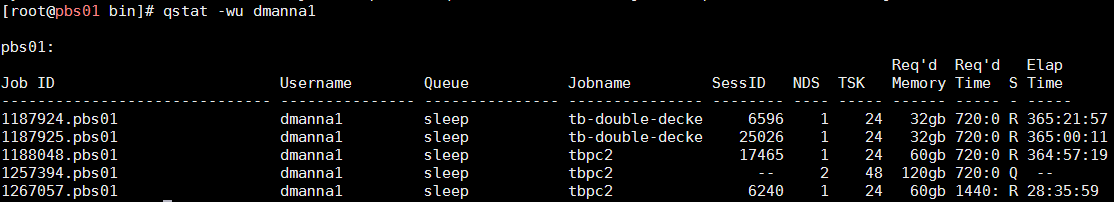
Ah, now it looks much better. In addition to the trivial parameters we can see how many compute nodes the job uses (NDS), how many cores (TSK) were requested, how much memory and time were requested, the job state (R – running, Q – waiting, S – suspended), and the time the job has already run.
TIP: Too many jobs? Want to see only jobs in queue? Use: 'qstat -iwu $USER'. This will show only the jobs waiting in a queue. Oppositely, 'qstat -rwu $USER' will show only running or suspended jobs.
Did you forget something and want to see all the information on jobs that already finished? No problem:
qstat -xwau $USER
will show jobs from the last FIVE days:
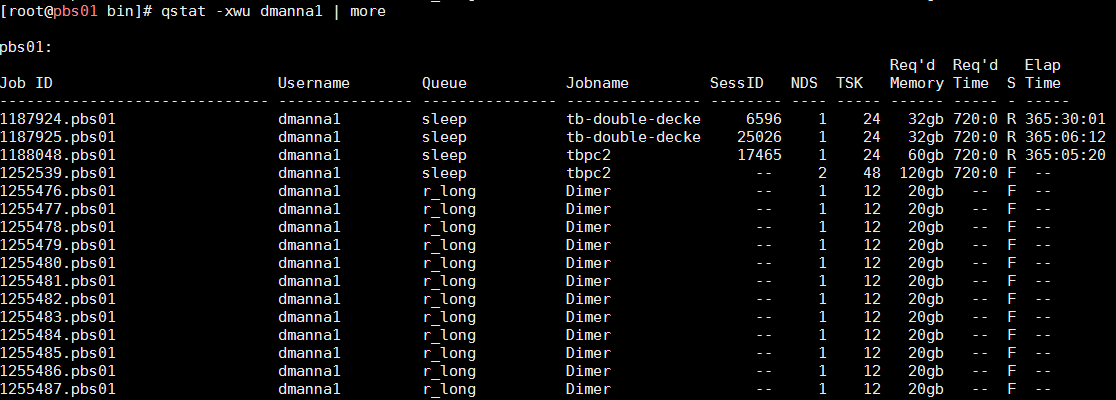
Where job state " F " means "Finished" (not "Failed").
Last but not least, sometimes you would like to know where the job is running? This next command will add the information to the last column:
qstat -n1rwu $USER
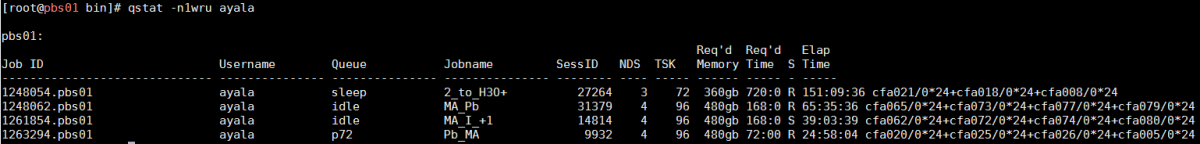
Note that the switch "1" is used here in order to see every job in a single line.
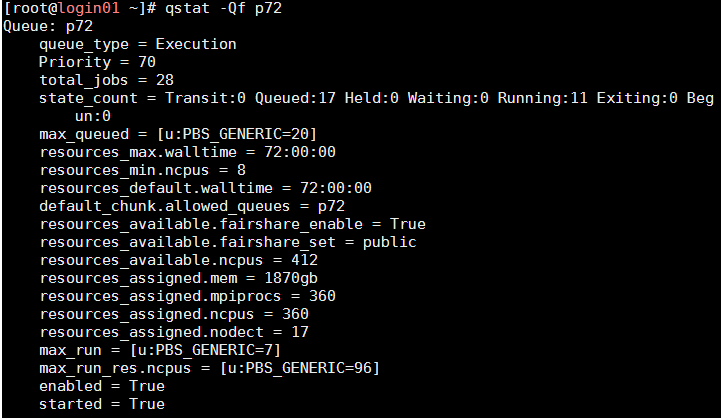
Other than this very central functionality, 'qstat' can also be used to retrieve the parameters defining each queue. For example,
qstat -Qf
tracejob
When you want to know what happened to your job since submission, 'tracejob' is there for you. Typical usage is:
tracejob
However, if you want to something that happened several days ago, you have to use:
tracejob -n
TIP: Filtering through this information requires some practice, try to notice recurring patterns when your jobs are misbehaving.

pbsnodes
This command retrieves all parameters relevant to a specific compute node.
pbsnodes
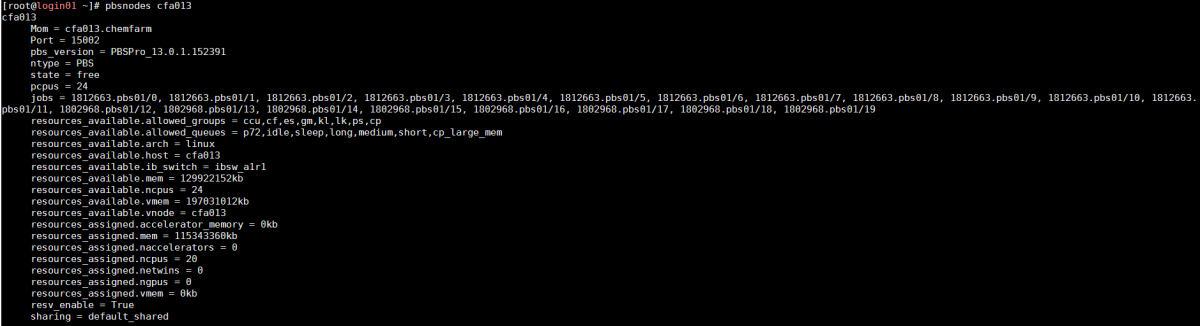
You can use this command to quickly see what jobs run on the node, what resources are available, which group(s) can use it and which queue(s) can utilize it.
Cluster status
Some commands flood your screen with supposedly useful information. For example, how many jobs are running, what is the general availability of the resources, etc. Here are couple of scripts that we prepared, which collects outputs from several other commands.
Command "qsum" will show concentrated information about the all running jobs by queue type and by group.
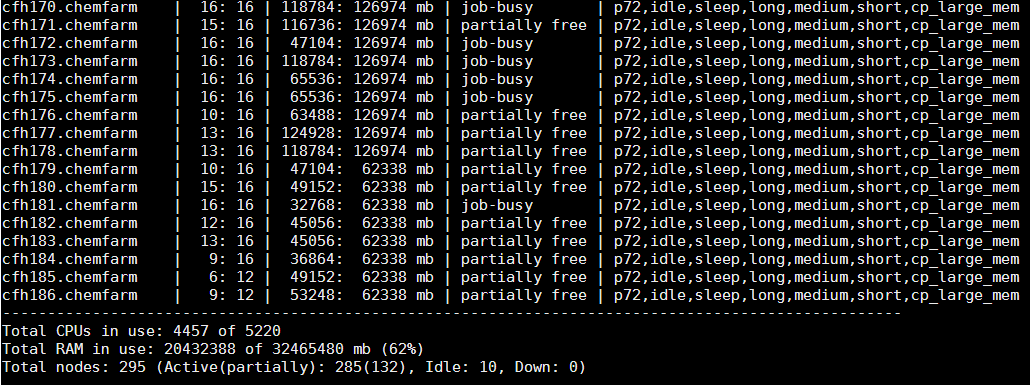
Command "nodelist" will provide a list of all nodes in a cluster and their status. The list is long, so here are the beginning and the end of it:
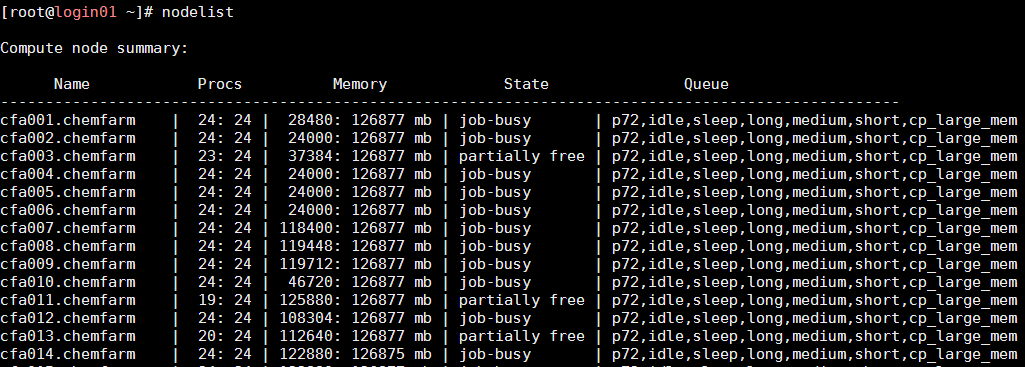
...