Parazoo N. C., Carroll D., Abshire J. B., Bar-On Y. M., Birdsey R. A., Bloom A. A., Bowman K. W., Braghiere R. K., Bruhwiler L. M., Byrne B., Chatterjee A., Crisp D., Duncanson L., Feldman A. F., Fox A. M., Frankenberg C., Gay B. A., Hopkins F., Hoffman F. M., Holmquist J. R., Hutyra L. R., Keller M., Koven C. D., Laughner J. L., Liu J., Lovenduski N. S., MacBean N., McKinley G. A., McNicol G., Menemenlis D., Michalak A. M., Miller C. E., Nesser H., Oda T., Ordway E. M., Ott L. E., Paustian K., Pierrat Z. A., Poulter B., Reed S. C., Schimel D. S., Serbin S. P., Saatchi S. S., Suto H., Windham-Myers L. & Wunch D.
(2026)
Earth-Science Reviews.
278,
105493.
Greenhouse gas (GHG) emissions continue to grow, while natural carbon reservoirs are becoming increasingly vulnerable to anthropogenic pressures, climate extremes, and disturbance. These changes are impacting humans, ecosystems, and natural resources worldwide. Tracking and mitigating GHG emissions require a pivot to operational monitoring of regional carbon flux and stock changes. The current GHG observing system is addressing needs at two distinct scales: 1) Local scale (< 1 km), related to anthropogenic point source emissions, and 2) global scales (> 1000 km), related to land and ocean carbon sinks. More focus on intermediate (101000 km) scales is needed to more effectively monitor progress in reducing carbon emissions, enhancing removals, and maintaining sinks.Representatives from carbon cycle biomass and flux communities across United States government agencies and academic institutions met in September 2024 to discuss the rationale and scientific context for more effectively implementing an operational system for GHG monitoring in support of urban and national carbon management needs. To guide development of this system, we propose a multi-tiered global spaceborne observing framework for carbon flux and stock, prioritizing: 1) frequent GHG partial columns for carbon emissions and removals; 2) continuous time series and data fusion of biomass from Lidar and Synthetic Aperture Radar (SAR) for carbon stocks, and 3) expanded coverage of tropical, high latitude, and oceanic regions to monitor carbon cycle tipping points and feedbacks. This system should be complemented by expanded surface and airborne networks for oceanic and terrestrial/aquatic ecosystems for calibration, ground truthing, and study of under-sampled regions. Plain language summary The rate of growth in global CO2 emissions has been in decline over the last decade following efforts to enact climate policy, shift to clean energy, and mitigate leaks from oil and gas facilities. This is good progress, but with emissions of both CO2 and methane (CH4) on the rise, time is running out to meet temperature targets. Spaceborne greenhouse gas (GHG) observations can help monitor emissions/removals and track progress at the urban- to country- level, but currently lack the frequency, coverage, and precision to do so. Representatives from the carbon cycle community convened in September 2024 to discuss viable options for addressing these limitations. We recommend a unified GHG observing system leveraging frequent (daily) sampling and vertical profiles of atmospheric GHGs to more accurately track carbon gains and losses, and harmonized maps of biomass to track growth, recovery, and disturbance. Expanded coverage of climate sensitive tropical, polar, and ocean regions is needed to monitor unexpected changes in the natural carbon cycle. Complementary data from airplanes and surface networks is needed to fill observational and science gaps. This system should prioritize timely delivery of carbon flux and stock information to support carbon management efforts.
Byrne B., Liu J., Domke G. M., Ogle S. M., Ferreira G. D., Bar-On Y. M., Nesser H., Bilir E., Bloom A. A., Hayes D. J., Poulter B., Bowman K. W. & Davis K. J.
(2026)
Global Biogeochemical Cycles.
40,
3,
e2025GB009.
Observations of atmospheric carbon dioxide (CO2) are expected to play a critical role in monitoring, reporting, and verification designed to track progress toward the reduction goals of greenhouse gas emissions. In this study, we construct a comprehensive regional carbon budget for seven National Climate Assessment regions of the contiguous United States (CONUS) over 20152020. We demonstrate that lateral carbon movement across regions, along with their resulting endpoint CO2 emissions, represent a major contributor to the interpretation of regional net surface-atmosphere fluxes of CO2. When accounting for lateral carbon fluxes, \u201ctop-down\u201d flux estimates from v10 Orbiting Carbon Observatory 2 (OCO-2) Modeling Intercomparison Project (MIP) agree, within uncertainty, with inventory-based carbon stock change estimates in six out of seven National Climate Assessment regions - except for the Southwest. The total net carbon exchange from the top down is 925 ± 339 Tg carbon per year (Tg C/year), consistent with the 974 Tg C/year estimate from the inventory. Notably, lateral carbon flows in the form of harvested wood products and riverine carbon burial are responsible for an estimated 16% of the total carbon stock changes occurring across CONUS. Averaged over the seven regions, accounting for lateral transport and their endpoint carbon emissions improves the consistency between inventory and top-down estimates by 31%. Our study presents a roadmap for reconciling the inventories and top-down atmospheric inversions at sub-national scale and highlights the importance of accurate representation of lateral carbon flows for using top-down estimates with national inventories.
Parazoo N., Carroll D., Abshire J. B., Bar-On Y. M., Birdsey R. A., Bloom A. A., Bowman K. W., Braghiere R. K., Bruhwiler L. M., Byrne B., Chatterjee A., Crisp D., Duncanson L., Feldman A. F., Fox A. M., Frankenberg C., Gay B. A., Hopkins F., Hoffman F. M., Holmquist J. R., Hutyra L. R., Keller M., Koven C. D., Laughner J. L., Liu J., Lovenduski N. S., Macbean N., McKinley G. A., McNicol G., Menemenlis D., Michalak A. M., Miller C. E., Nesser H., Oda T., Ordway E. M., Ott L. E., Paustian K., Pierrat Z. A., Poulter B., Reed S. C., Schimel D. S., Serbin S. P., Saatchi S. S., Suto H., Windham-Myers L. & Wunch D.
(2025)
AGU Advances.
6,
6,
e2025AV001.
Managing carbon stocks in the land, ocean, and atmosphere under changing climate requires a globally-integrated view of carbon cycle processes at local and regional scales. The growing Earth Observation (EO) record is the backbone of this multi-scale system, providing local information with discrete coverage from surface measurements and regional information at global scale from satellites. Carbon flux information, anchored by inverse estimates from spaceborne Greenhouse Gas (GHG) concentrations, provides an important top-down view of carbon emissions and sinks, but currently lacks global continuity at assessment and management scales (
Wang H., Ciais P., Yang H., Smith P., Grassi G., Schwingshackl C., Panagos P., Bar-On Y., Sitch S., Chevallier F., Palmer P. I., Li X., Hong S., Chang J., Albergel C., Fan L., Wang K., Liu L., Frappart F. & Wigneron J. P.
(2025)
Nature Communications.
16,
10008.
Soil carbon changes are difficult to measure globally, and global models are poorly constrained. Here, we propose a framework to map annual changes in soil carbon and litter (SOCL) as the difference between the net land CO2 flux from atmospheric inversions and satellite-based maps of biomass changes. We show that SOCL accumulated globally at a rate of about 0.34 ± 0.30 (± 1 sigma) billion tonnes of carbon per year (PgC yr−1) during 2011-2020. The largest SOCL sink is found in boreal regions (0.93 ± 0.45 PgC yr−1 in total) particularly in undisturbed peatlands and managed forests. The largest losses occur in the dry tropics (−0.50 ± 0.47 PgC yr−1) and correspond with agricultural expansion from land use change, cropland management and grazing. By contrast, forests in the wet tropics act as a net soil carbon sink (0.32 ± 0.35 PgC yr−1). Our findings highlight the large mitigation opportunities in the dry tropics to restore agricultural soil carbon.
Worden M. A., Bilir T. E., Bloom A. A., Fang J., Klinek L. P., Konings A. G., Levine P. A., Milodowski D. T., Quetin G. R., Smallman T. L., Bar-On Y. M., Braghiere R. K., David C. H., Fischer N. A., Gentine P., Green T. J., Jones A., Liu J., Longo M., Ma S., Magney T. S., Massoud E. C., Myrgiotis V., Norton A. J., Parazoo N., Tajfar E., Trugman A. T., Williams M., Worden S., Zhao W. & Zhu S.
(2025)
Global Change Biology.
31,
8,
e70462.
The rapid increase in the volume and variety of terrestrial biosphere observations (i.e., remote sensing data and in situ measurements) offers a unique opportunity to derive ecological insights, refine process-based models, and improve forecasting for decision support. However, despite their potential, ecological observations have primarily been used to benchmark process-based models, as many past and current models lack the capability to directly integrate observations and their associated uncertainties for parameterization. In contrast, data assimilation frameworks such as the CARbon DAta MOdel fraMework (CARDAMOM) and its suite of process-based models, known as the Data Assimilation Linked Ecosystem Carbon Model (DALEC), are specifically designed for model-data fusion. This review, motivated by a recent CARDAMOM community workshop, examines the development and applications of CARDAMOM, with an emphasis on its role in advancing ecosystem process understanding. CARDAMOM employs a Bayesian approach, using a Markov Chain Monte Carlo algorithm to enable data-driven calibration of DALEC parameters and initial states (i.e., carbon pool sizes) through observation operators. CARDAMOM's unique ability to retrieve localized model process parameters from diverse datasets-ranging from in situ measurements to global satellite observations-makes it a highly flexible tool for analyzing spatially variable ecosystem responses to environmental change. However, assimilating these data also presents challenges, including data quality issues that propagate into model skill, as well as trade-offs between model complexity, parameter equifinality, and predictive performance. We discuss potential solutions to these challenges, such as reducing parameter equifinality by incorporating new observations. This review also offers community recommendations for incorporating emerging datasets, integrating machine learning techniques, strengthening collaboration with remote sensing, field, and modeling communities, and expanding CARDAMOM's relevance for localized ecosystem monitoring and decision-making. CARDAMOM enables a deep, mechanistic understanding of terrestrial ecosystem dynamics that cannot be achieved through empirical analyses of observational datasets or weakly constrained models alone.
Jia R., Fricke E., Malhotra A., Bar-On Y. M., Deng J., Piñeiro G., Bazzoni B., Alvarez R., Findlay N., te Beest M., Zhou Y., Boutton T. W., Dar J. A., Kothandaraman S., MacDougall A. S., Eisenhauer N., Peri P. L., Zheng J., Power S. A., Reed S. C., Macek P., Haider S., Sitch S., OSullivan M., Friedlingstein P., Bond-Lamberty B., Hungate B. A., Jackson R. B., Subramanian M., Patel K. & Terrer C.
(2025)
BioRxiv.
Partitioning the terrestrial carbon sink between vegetation and soil is crucial for predicting future climate change, but the role of soils remains poorly quantified. Here, we compiled 3,099 soil organic carbon time series spanning five decades. We found a global soil organic carbon sink of 1.83 textpm 0.9 (mean textpm SE) petagrams per year from 1992 to 2020, driven by extratropical young forests, boreal old forests, and grasslands, while trends in tropical ecosystems remain uncertain. Our findings suggest the net land sink resides almost exclusively belowground as soil carbon, emphasizing the global opportunity of soil conservation and restoration for climate mitigation.Competing Interest StatementThe authors have declared no competing interest.This material is based upon work supported by the National Science Foundation under Grant No. DEB-2339051. This research was supported by a seed award from the MIT Climate and Sustainability Consortium. This is a contribution of the MIT Terrer Lab. AM was supported by a Laboratory Directed Research and Development Program at PNNL. This work was generated using data from the Nutrient Network (This material is based upon work supported by the National Science Foundation under Grant No. DEB-2339051. This research was supported by a seed award from the MIT Climate and Sustainability Consortium. This is a contribution of the MIT Terrer Lab. AM was supported by a Laboratory Directed Research and Development Program at PNNL. This work was generated using data from the Nutrient Network (http://www.nutnet.org) experiment, funded at the site-scale by individual researchers. Coordination and data management have been supported by funding to E. Borer and E. Seabloom from the National Science Foundation Research Coordination Network (NSF-DEB-1042132) and Long Term Ecological Research (NSF-DEB-1234162 and NSF-DEB-1831944 to Cedar Creek LTER) programs, and the Institute on the Environment (DG-0001-13). We also thank the Minnesota Supercomputer Institute for hosting project data and the Institute on the Environment for hosting Network meetings. Soil analyses were supported, in part, by USDA-ARS grant 58-3098-7-007 to ETB. The evaluation was based on data that was collected by partners of the official UNECE ICP Forests Network (http://icp-forests.net/contributors). Part of the data was co-financed by the European Commission (Data achieved at 10/12/2023)., ,
Bar-On Y. M., Li X., O'Sullivan M., Wigneron J., Sitch S., Ciais P., Frankenberg C. & Fischer W. W.
(2025)
Science.
387,
6740,
p. 1291-1295
Terrestrial sequestration of carbon has mitigated approximate to 30% of anthropogenic carbon emissions. However, its distribution across different pools, live or dead biomass and soil and sedimentary organic carbon, remains uncertain. Analyzing global observational datasets of changes in terrestrial carbon pools, we found that approximate to 35 +/- 14 gigatons of carbon (GtC) have been sequestered on land between 1992 and 2019, whereas live biomass changed by approximate to 1 +/- 7 GtC. Global vegetation models instead imply that sequestration has been mostly in live biomass. We identify key processes not included in most models that can explain this discrepancy. Most terrestrial carbon gains are sequestered as nonliving matter and thus are more persistent than previously appreciated, with a substantial fraction linked to human activities such as river damming, wood harvest, and garbage disposal in landfills.
Lotem N., Rasmussen B., Zi J. -., Zeichner S. S., Present T. M., On Y. M. B. & Fischer W. W.
(2025)
Proceedings of the National Academy of Sciences - PNAS.
122,
2,
2417673121.
The organic carbon content of ancient rocks provides a fundamental record of the biosphere on early Earth. For over 50 y, the high organic content of Archean (>2.5 Ga) mudrocks has puzzled geologists and evolutionary biologists, because high biological primary productivity was unexpected for the nascent biosphere before the rise of O-2. Here, we took a different approach to resolve this apparent paradox, by studying the accumulation rates of Archean organic-rich mudrocks. We evaluated the sedimentation rates of three sections of the Mount McRae Shale and Jeerinah Formation (2.68 to 2.48 Ga, Pilbara Craton, Australia) with new and recently published U-Pb zircon ages from intraformational ash beds. For comparison, we compiled Phanerozoic (
de Pins B., Greenspoon L., Bar-On Y. M., Shamshoum M., Ben-Nissan R., Milshtein E., Davidi D., Sharon I., Mueller-Cajar O., Noor E. & Milo R.
(2024)
EMBO Journal.
43,
14,
p. 3072-3083
Autotrophy is the basis for complex life on Earth. Central to this process is rubiscothe enzyme that catalyzes almost all carbon fixation on the planet. Yet, with only a small fraction of rubisco diversity kinetically characterized so far, the underlying biological factors driving the evolution of fast rubiscos in nature remain unclear. We conducted a high-throughput kinetic characterization of over 100 bacterial form I rubiscos, the most ubiquitous group of rubisco sequences in nature, to uncover the determinants of rubiscos carboxylation velocity. We show that the presence of a carboxysome CO2 concentrating mechanism correlates with faster rubiscos with a median fivefold higher rate. In contrast to prior studies, we find that rubiscos originating from α-cyanobacteria exhibit the highest carboxylation rates among form I enzymes (≈10 s−1 median versus
Frankenberg C., Bar-On Y. M., Yin Y., Wennberg P. O., Jacob D. J. & Michalak A. M.
(2024)
Geophysical Research Letters.
51,
8,
e2024GL108.
Diagnosing land-atmosphere fluxes of carbon-dioxide (CO2) and methane (CH4) is essential for evaluating carbon-climate feedbacks. Greenhouse gas satellite missions aim to fill data gaps in regions like the humid tropics but obtain very few valid measurements due to cloud contamination. We examined data yields from the Orbiting Carbon Observatory alongside Sentinel-2 cloud statistics. We find that the main contribution to low data yields are frequent shallow cumulus clouds. In the Amazon, the success rate in obtaining valid measurements vary from 0.1% to 1.0%. By far the lowest yields occur in the wet season, consistent with Sentinel-2 cloud patterns. We find that increasing the spatial resolution of observations to similar to 200 m would increase yields by 2-3 orders of magnitude and allow regular measurements in the wet season. Thus, the key to effective tropical greenhouse gas observations lies in regularly acquiring high-spatial resolution data.Our research looks at how well satellites are able to observe greenhouse gases such as carbon dioxide and methane in tropical areas, which is important for understanding climate change. We find that these satellites often cannot make good measurements in places like the Amazon rainforest due to clouds. By using space-based instruments that can peek in between clouds (requiring about similar to 200 m spatial resolution), we would get much more frequent information, even during the rainy season. Our study shows that high-spatial resolution is needed to regularly observe greenhouse gases in the tropics.Data yields of current remotely sensed greenhouse gas (GHG) missions in the humid tropics are often below 1% Shallow cumulus clouds cause most of the low data yields, esp. in the wet season Finer spatial resolution (similar to 200 m) can overcome the data sparsity in the tropics
Yao Y., Humphrey V., Konings A. G., Wang Y., Yin Y., Holtzman N., Wood J. D., Bar-On Y. & Frankenberg C.
(2024)
Geophysical Research Letters.
51,
6,
e2023GL107.
Vegetation Optical Depth (VOD) has emerged as a valuable metric to quantify water stress on vegetation's carbon uptake from a remote sensing perspective. However, existing spaceborne microwave remote sensing platforms face limitations in capturing the diurnal VOD variations and global products lack site-level validation against plant physiology. To address these challenges, we leveraged the Global Navigation Satellite System (GNSS) L-band microwave signal, measuring its attenuation by the canopy of a temperate broadleaf forest using a pair of GNSS receivers. This approach allowed us to collect continuous VOD observations at a sub-hourly scale. We found a significant seasonal-scale correlation between VOD and leaf water potential. The VOD diurnal amplitude is affected by soil moisture, plant transpiration and leaf surface water. Additionally, VOD can help independently estimate plant transpiration. Our findings pave the way for a deeper understanding of response of the vegetation to water stress at finer temporal scales.Microwave satellite measurements offer valuable insights into Vegetation Optical Depth (VOD), which reflects the amount of water present in plants. However, most VOD products currently available only offer observations at two times of the day, which fail to capture the variations of VOD over the course of the day. In this study, we installed Global Navigation Satellite System (GNSS) signal receivers at the top and bottom of a temperate broadleaf forest canopy located at a flux tower in Missouri, USA. This setup allowed us to obtain continuous observations of VOD at sub-hourly scale. The strong correlation observed between GNSS VOD and local leaf water potential suggests that this robust and cost-effective technique can complement other labor-intensive measurements. The VOD diurnal amplitude is influenced by soil water content, evapotranspiration, and leaf surface water in the form of dew and interception. GNSS VOD also exhibits the potential to aid in estimating plant transpiration, which can be further used for partitioning evapotranspiration. The investigation of plant water content dynamics in this study will enhance our understanding of the carbon-water coupling at a finer temporal scale.Sub-hourly Vegetation Optical Depth (VOD) retrieved from Global Navigation Satellite Systems attenuation relates to soil and leaf water dynamics Daily maximum VOD correlates well with field measurements of predawn leaf water potential Plant transpiration can be reconstructed from VOD principal components
Bar-On Y., Baron T., Cornfeld O. & Yashiv E.
(2023)
Review of Economic Dynamics.
51,
p. 292-321
We present novel policy tools to manage epidemics. Rather than using prevalent population restrictions, these policy strategies are based on cyclical time restrictions. Key findings on the outcomes of such policy strategies include: a significant improvement of social welfare, substantially lessening the trade-offs between economic activity and health outcomes; optimally-derived timings of interventions are shown to suppress the disease, while maintaining reasonable economic activity; and outcomes are superior to the actual experience of New York State and Florida over the course of 2020.
We propose new time-based tools to manage epidemics and analyze them from both normative and positive perspectives.The proposed policy relies on time restrictions and consists of alternating periods of work and lockdown, at pre-defined frequencies.The epidemiological rationale for the proposed policy is based on the timescales of virus transmission.Optimal application of the proposed instruments uses mandated lockdowns and takes into account endogenous individual procautionary behavior.These policy instruments significantly lessen the trade-offs between economic outcomes and public health outcomes.
Amir O., Goldberg Y., Mandel M., Bar-On Y. M., Bodenheimer O., Freedman L., Alroy-Preis S., Ash N., Huppert A. & Milo R.
(2023)
Communications Biology.
6,
315.
Following evidence of waning immunity against both infection and severe disease after 2 doses of the BNT162b2 vaccine, Israel began administering a 3rd BNT162b2 dose (booster) in July 2021. Recent studies showed that the 3rd dose provides a much lower protection against infection with the Omicron variant compared to the Delta variant and that this protection wanes quickly. However, there is little evidence regarding the protection of the 3rd dose against Omicron (BA.1/BA.2) severe disease. In this study, we estimate the preservation of immunity from severe disease up to 7 months after receiving the booster dose. We calculate rates of severe SARS-CoV-2 disease between groups of individuals aged 60 and above, comparing those who received two doses at least 4 months previously to those who received the 3rd dose (stratified by the time from vaccination), and to those who received a 4th dose. The analysis shows that protection conferred by the 3rd dose against Omicron severe disease did not wane over a 7-month period. Moreover, a 4th dose further improved protection, with a severe disease rate approximately 3-fold lower than in the 3-dose cohorts.
Crockford P. W., Bar On Y. M., Ward L. M., Milo R. & Halevy I.
(2023)
Current Biology.
33,
21,
p. 4741-4750.e5
The rate of primary productivity is a keystone variable in driving biogeochemical cycles today and has been throughout Earth's past.1 For example, it plays a critical role in determining nutrient stoichiometry in the oceans,2 the amount of global biomass,3 and the composition of Earth's atmosphere.4 Modern estimates suggest that terrestrial and marine realms contribute near-equal amounts to global gross primary productivity (GPP).5 However, this productivity balance has shifted significantly in both recent times6 and through deep time.7,8 Combining the marine and terrestrial components, modern GPP fixes ≈250 billion tonnes of carbon per year (Gt C year−1).5,9,10,11 A grand challenge in the study of the history of life on Earth has been to constrain the trajectory that connects present-day productivity to the origin of life. Here, we address this gap by piecing together estimates of primary productivity from the origin of life to the present day. We estimate that ∼10111012 Gt C has cumulatively been fixed through GPP (≈100 times greater than Earth's entire carbon stock). We further estimate that 10391040 cells have occupied the Earth to date, that more autotrophs than heterotrophs have ever existed, and that cyanobacteria likely account for a larger proportion than any other group in terms of the number of cells. We discuss implications for evolutionary trajectories and highlight the early Proterozoic, which encompasses the Great Oxidation Event (GOE), as the time where most uncertainty exists regarding the quantitative census presented here.
Goldberg Y., Amir O., Mandel M., Freedman L., Bar-On Y. M., Bodenheimer O., Milo R. & Huppert A.
(2023)
Journal of Clinical Epidemiology.
163,
p. 111-116
Objectives: This study aims to address limitations in assessing vaccine protection using the classical vaccine effectiveness (VE) measure, especially in contexts where a significant portion of the population is already vaccinated or infected. Study Design and Setting: We propose using the adjusted number of cases (ANC) as a building block for deriving vaccine effectiveness measures. This approach accounts for biases arising from small and unrepresentative unvaccinated reference groups with incomplete data. We demonstrate the use of these measures for assessing the protection conferred by a booster dose against severe COVID-19 using data from Israel. Results: The use of ANC and the derived measures reveals a more comprehensive understanding of the complex immunity landscape compared to traditional VE measures. This approach enables meaningful comparisons between different vaccination categories and provides insights to inform policy decisions. Conclusion: In situations with widespread vaccination and prior infections, traditional VE measures can be limited in their informative value. Using the ANC offers a more robust and insightful assessment of vaccine effectiveness. A demonstration of the evaluation of booster dose protection against severe COVID-19 in Israel underscores the importance of adopting complementary measures to guide public health strategies.
Amir O., Goldberg Y., Mandel M., Bar-On Y. M., Freedman L. S., Bodenheimer O., Huppert A. & Milo R.
(2023)
International Journal of Epidemiology.
52,
5,
p. 1299-1302
Park S. W., Sun K., Abbott S., Sender R., Bar-On Y. M., Weitz J. S., Funk S., Grenfell B. T., Backer J. A., Wallinga J., Viboud C. & Dushoff J.
(2023)
Proceedings of the National Academy of Sciences - PNAS.
120,
22,
e222188712.
Estimating the differences in the incubation-period, serial-interval, and generation-interval distributions of SARS-CoV-2 variants is critical to understanding their transmission. However, the impact of epidemic dynamics is often neglected in estimating the timing of infectionfor example, when an epidemic is growing exponentially, a cohort of infected individuals who developed symptoms at the same time are more likely to have been infected recently. Here, we reanalyze incubation-period and serial-interval data describing transmissions of the Delta and Omicron variants from the Netherlands at the end of December 2021. Previous analysis of the same dataset reported shorter mean observed incubation period (3.2 d vs. 4.4 d) and serial interval (3.5 d vs. 4.1 d) for the Omicron variant, but the number of infections caused by the Delta variant decreased during this period as the number of Omicron infections increased. When we account for growth-rate differences of two variants during the study period, we estimate similar mean incubation periods (3.8 to 4.5 d) for both variants but a shorter mean generation interval for the Omicron variant (3.0 d; 95% CI: 2.7 to 3.2 d) than for the Delta variant (3.8 d; 95% CI: 3.7 to 4.0 d). The differences in estimated generation intervals may be driven by the \u201cnetwork effect\u201dhigher effective transmissibility of the Omicron variant can cause faster susceptible depletion among contact networks, which in turn prevents late transmission (therefore shortening realized generation intervals). Using up-to-date generation-interval distributions is critical to accurately estimating the reproduction advantage of the Omicron variant.
Greenspoon L., Krieger E., Sender R., Rosenberg Y., Bar-On Y. M., Moran U., Antman T., Meiri S., Roll U., Noor E. & Milo R.
(2023)
Proceedings of the National Academy of Sciences of the United States of America.
120,
10,
e220489212.
Wild mammals are icons of conservation efforts, yet there is no rigorous estimate available for their overall global biomass. Biomass as a metric allows us to compare species with very different body sizes, and can serve as an indicator of wild mammal presence, trends, and impacts, on a global scale. Here, we compiled estimates of the total abundance (i.e., the number of individuals) of several hundred mammal species from the available data, and used these to build a model that infers the total biomass of terrestrial mammal species for which the global abundance is unknown. We present a detailed assessment, arriving at a total wet biomass of ≈20 million tonnes (Mt) for all terrestrial wild mammals (95% CI 13-38 Mt), i.e., ≈3 kg per person on earth. The primary contributors to the biomass of wild land mammals are large herbivores such as the white-tailed deer, wild boar, and African elephant. We find that even-hoofed mammals (artiodactyls, such as deer and boars) represent about half of the combined mass of terrestrial wild mammals. In addition, we estimated the total biomass of wild marine mammals at ≈40 Mt (95% CI 20-80 Mt), with baleen whales comprising more than half of this mass. In order to put wild mammal biomass into perspective, we additionally estimate the biomass of the remaining members of the class Mammalia. The total mammal biomass is overwhelmingly dominated by livestock (≈630 Mt) and humans (≈390 Mt). This work is a provisional census of wild mammal biomass on Earth and can serve as a benchmark for human impacts.
Rosenberg Y., Bar-On Y. M., Fromm A., Ostikar M., Shoshany A., Giz O. & Milo R.
(2023)
Science advances.
9,
5,
eabq4049.
Insects and other arthropods are central to terrestrial ecosystems. However, data are lacking regarding their global population abundance. We synthesized thousands of evaluations from around 500 sites worldwide, estimating the absolute biomass and abundance of terrestrial arthropods across different taxa and habitats. We found that there are approximate to 1 x 10(19) (twofold uncertainty range) soil arthropods on Earth, approximate to 95% of which are soil mites and springtails. The soil contains approximate to 200 (twofold uncertainty range) million metric tons (Mt) of dry biomass. Termites contribute approximate to 40% of the soil biomass, much more than ants at approximate to 10%. Our estimate for the global biomass of above-ground arthropods is more uncertain, highlighting a knowledge gap that future research should aim to close. We estimate the combined dry biomass of all terrestrial arthropods at approximate to 300 Mt (uncertainty range, 100 to 500), similar to the mass of humanity and its livestock. These estimates enhance the quantitative understanding of arthropods in terrestrial ecosystems and provide an initial holistic benchmark on their decline.
Amir O., Goldberg Y., Mandel M., Bar-On Y. M., Bodenheimer O., Freedman L., Ash N., Alroy-Preis S., Huppert A. & Milo R.
(2023)
The Lancet Infectious Diseases.
23,
1,
p. 67-73
Background: The BNT162b2 (Pfizer-BioNTech) two-dose vaccine regiment for children and the BNT162b2 third dose for adolescents were approved shortly before the SARS-CoV-2 omicron (B.1.1.529) outbreak in Israel. We aimed to estimate the effects of these vaccines on the rates of confirmed infection against the omicron variant in children and adolescents. Methods: In this observational cohort study, we extracted data for the omicron-dominated (sublineage BA.1) period. We compared rates of confirmed SARS-CoV-2 infection between children aged 510 years 1435 days after receiving the second vaccine dose with an internal control group of children 37 days after receiving the first dose (when the vaccine is not yet effective). Similarly, we compared confirmed infection rates in adolescents aged 1215 years 1460 days after receiving a booster dose with an internal control group of adolescents 37 days after receiving the booster dose. We used Poisson regression, adjusting for age, sex, socioeconomic status, calendar week, and exposure. Findings: Between Dec 26, 2021, and Jan 8, 2022, we included 1 158 289 participants. In children aged 510 years, the adjusted rate of confirmed infection was 2·3 times (95% CI 2·02·5) lower in children who received a second dose than in the internal control group. The adjusted infection rate in children who received a second dose was 102 infections per 100 000 risk-days (94110) compared with 231 infections per 100 000 risk-days (215248) in the corresponding internal control cohort. In adolescents aged 1215 years, the booster dose decreased confirmed infection rates by 3·3 times (2·84·0) compared with in the internal control group. The adjusted infection rate of the booster cohort was 70 per 100 000 risk-days (6081) compared with 232 per 100 000 risk-days (212254) in the internal control cohort. Interpretation: A recent two-dose vaccination regimen with BNT162b2 and a recent booster dose in adolescents substantially reduced the rate of confirmed infection compared with the internal control groups. Future studies are needed to assess the duration of this protection and protection against other outcomes such as paediatric inflammatory multisystem syndrome temporally associated with SARS-CoV-2 and long-COVID. Funding: None.
Amir O., Goldberg Y., Mandel M., Bar-On Y. M., Bodenheimer O., Ash N., Alroy-Preis S., Huppert A. & Milo R.
(2022)
Nature Communications.
13,
1,
1971.
Israel began administering a BNT162b2 booster dose to restore protection following the waning of the 2-dose vaccine. Biological studies have shown that a "fresh" booster dose leads to increased antibody levels compared to a fresh 2-dose vaccine, which may suggest increased effectiveness. To compare the real-world effectiveness of a fresh (up to 60 days) booster dose with that of a fresh 2-dose vaccine, we took advantage of a quasi-experimental study that compares populations that were eligible to receive the vaccine at different times due to age-dependent policies. Specifically, we compared the confirmed infection rates in adolescents aged 12-14 (215,653 individuals) who received the 2-dose vaccine and in adolescents aged 16-18 (103,454 individuals) who received the booster dose. Our analysis shows that the confirmed infection rate was lower by a factor of 3.7 (95% CI: 2.7 to 5.2) in the booster group.
Chure G., Banks R. A., Flamholz A. I., Sarai N. S., Kamb M., Lopez-Gomez I., Bar-On Y., Milo R. & Phillips R.
(2022)
Patterns.
3,
9,
100552.
The Human Impacts Database (www.anthroponumbers.org) is a curated, searchable resource housing quantitative data relating to the diverse anthropogenic impacts on our planet, with topics ranging from sea-level rise to livestock populations, greenhouse gas emissions, fertilizer use, and beyond. Each entry in the database reports a quantitative value (or a time series of values) along with clear referencing of the primary source, the method of measurement or estimation, an assessment of uncertainty, and links to the underlying data, as well as a permanent identifier called a Human Impacts ID (HuID). While there are other databases that house some of these values, they are typically focused on a single topic area, like energy usage or greenhouse gas emissions. The Human Impacts Database facilitates access to carefully curated data, acting as a quantitative resource pertaining to the myriad ways in which humans have an impact on the Earth, for practicing scientists, the general public, and those involved in education for sustainable development alike. We outline the structure of the database, describe our curation procedures, and use this database to generate a graphical summary of the current state of human impacts on the Earth, illustrating both their numerical values and their intimate interconnections.
Sender R., Bar-On Y., Park S. W., Noor E., Dushoff J. & Milo R.
(2022)
eLife.
11,
e79134.
Quantifying the temporal dynamics of infectiousness of individuals infected with SARS-CoV-2 is crucial for understanding the spread of COVID-19 and for evaluating the effectiveness of mitigation strategies. Many studies have estimated the infectiousness profile using observed serial intervals. However, statistical and epidemiological biases could lead to underestimation of the duration of infectiousness. We correct for these biases by curating data from the initial outbreak of the pandemic in China (when mitigation was minimal), and find that the infectiousness profile of the original strain is longer than previously thought. Sensitivity analysis shows our results are robust to model structure, assumed growth rate and potential observational biases. Although unmitigated transmission data is lacking for variants of concern (VOCs), previous analyses suggest that the alpha and delta variants have faster within-host kinetics, which we extrapolate to crude estimates of variant-specific unmitigated generation intervals. Knowing the unmitigated infectiousness profile of infected individuals can inform estimates of the effectiveness of isolation and quarantine measures. The framework presented here can help design better quarantine policies in early stages of future epidemics.
Goldberg Y., Mandel M., Bar-On Y. M., Bodenheimer O., Freedman L. S., Ash N., Alroy-Preis S., Huppert A. & Milo R.
(2022)
New England Journal of Medicine.
386,
23,
p. 2201-2212
BACKGROUND Infection with severe acute respiratory syndrome coronavirus 2 (SARS-CoV-2) provides natural immunity against reinfection. Recent studies have shown waning of the immunity provided by the BNT162b2 vaccine. The time course of natural and hybrid immunity is unknown. METHODS Using the Israeli Ministry of Health database, we extracted data for August and September 2021, when the B.1.617.2 (delta) variant was predominant, on all persons who had been previously infected with SARS-CoV-2 or who had received coronavirus 2019 vaccine. We used Poisson regression with adjustment for confounding factors to compare the rates of infection as a function of time since the last immunity-conferring event. RESULTS The number of cases of SARS-CoV-2 infection per 100,000 person-days at risk (adjusted rate) increased with the time that had elapsed since vaccination with BNT162b2 or since previous infection. Among unvaccinated persons who had recovered from infection, this rate increased from 10.5 among those who had been infected 4 to less than 6 months previously to 30.2 among those who had been infected 1 year or more previously. Among persons who had received a single dose of vaccine after previous infection, the adjusted rate was low (3.7) among those who had been vaccinated less than 2 months previously but increased to 11.6 among those who had been vaccinated at least 6 months previously. Among previously uninfected persons who had received two doses of vaccine, the adjusted rate increased from 21.1 among those who had been vaccinated less than 2 months previously to 88.9 among those who had been vaccinated at least 6 months previously. CONCLUSIONS Among persons who had been previously infected with SARS-CoV-2 (regardless of whether they had received any dose of vaccine or whether they had received one dose before or after infection), protection against reinfection decreased as the time increased since the last immunity-conferring event; however, this protection was higher than that conferred after the same time had elapsed since receipt of a second dose of vaccine among previously uninfected persons. A single dose of vaccine after infection reinforced protection against reinfection.
BarOn Y. M., Goldberg Y., Mandel M., Bodenheimer O., Amir O., Freedman L., Alroy-Preis S., Ash N., Huppert A. & Milo R.
(2022)
New England Journal of Medicine.
386,
18,
p. 1712-1720
The spread of the omicron variant produced an increase in Covid-19 in Israel in late 2021, and a second boost of BNT162b2 vaccine was authorized in early January 2022. This article reports the efficacy of the fourth dose among Israeli citizens 60 years of age or older. Rates of severe illness were reduced by a factor of 3.5 in the fourth week after the second boost.
Goldberg Y., Mandel M., Bar-On Y. M., Bodenheimer O., Freedman L., Haas E. J., Milo R., Alroy-Preis S., Ash N. & Huppert A.
(2021)
New England Journal of Medicine.
385,
24,
p. E85-E85
e85.
BACKGROUND In December 2020, Israel began a mass vaccination campaign against coronavirus disease 2019 (Covid-19) by administering the BNT162b2 vaccine, which led to a sharp curtailing of the outbreak. After a period with almost no cases of severe acute respiratory syndrome coronavirus 2 (SARS-CoV-2) infection, a resurgent Covid-19 outbreak began in mid-June 2021. Possible reasons for the resurgence were reduced vaccine effectiveness against the delta (B.1.617.2) variant and waning immunity. The extent of waning immunity of the vaccine against the delta variant in Israel is unclear. METHODS We used data on confirmed infection and severe disease collected from an Israeli national database for the period of July 11 to 31, 2021, for all Israeli residents who had been fully vaccinated before June 2021. We used a Poisson regression model to compare rates of confirmed SARS-CoV-2 infection and severe Covid-19 among persons vaccinated during different time periods, with stratification according to age group and with adjustment for possible confounding factors. RESULTS Among persons 60 years of age or older, the rate of infection in the July 1131 period was higher among persons who became fully vaccinated in January 2021 (when they were first eligible) than among those fully vaccinated 2 months later, in March (rate ratio, 1.6; 95% confidence interval [CI], 1.3 to 2.0). Among persons 40 to 59 years of age, the rate ratio for infection among those fully vaccinated in February (when they were first eligible), as compared with 2 months later, in April, was 1.7 (95% CI, 1.4 to 2.1). Among persons 16 to 39 years of age, the rate ratio for infection among those fully vaccinated in March (when they were first eligible), as compared with 2 months later, in May, was 1.6 (95% CI, 1.3 to 2.0). The rate ratio for severe disease among persons fully vaccinated in the month when they were first eligible, as compared with those fully vaccinated in March, was 1.8 (95% CI, 1.1 to 2.9) among persons 60 years of age or older and 2.2 (95% CI, 0.6 to 7.7) among those 40 to 59 years of age; owing to small numbers, the rate ratio could not be calculated among persons 16 to 39 years of age. CONCLUSIONS These findings indicate that immunity against the delta variant of SARS-CoV-2 waned in all age groups a few months after receipt of the second dose of vaccine.
Bar-On Y. M., Goldberg Y., Mandel M., Bodenheimer O., Freedman L., Alroy-Preis S., Ash N., Huppert A. & Milo R.
(2021)
New England Journal of Medicine.
385,
26,
p. 2421-2430
BACKGROUND After promising initial results from the administration of a third (booster) dose of the BNT162b2 messenger RNA vaccine (PfizerBioNTech) to persons 60 years of age or older, the booster campaign in Israel was gradually expanded to persons in younger age groups who had received a second dose at least 5 months earlier. METHODS We extracted data for the period from July 30 to October 10, 2021, from the Israel Ministry of Health database regarding 4,696,865 persons 16 years of age or older who had received two doses of BNT162b2 at least 5 months earlier. In the primary analysis, we compared the rates of confirmed coronavirus disease 2019 (Covid-19), severe illness, and death among those who had received a booster dose at least 12 days earlier (booster group) with the rates among those who had not received a booster (nonbooster group). In a secondary analysis, we compared the rates in the booster group with the rates among those who had received a booster 3 to 7 days earlier (early postbooster group). We used Poisson regression models to estimate rate ratios after adjusting for possible confounding factors. RESULTS The rate of confirmed infection was lower in the booster group than in the nonbooster group by a factor of approximately 10 (range across five age groups, 9.0 to 17.2) and was lower in the booster group than in the early postbooster group by a factor of 4.9 to 10.8. The adjusted rate difference ranged from 57.0 to 89.5 infections per 100,000 person-days in the primary analysis and from 34.4 to 38.3 in the secondary analysis. The rates of severe illness in the primary and secondary analyses were lower in the booster group by a factor of 17.9 (95% confidence interval [CI], 15.1 to 21.2) and 6.5 (95% CI, 5.1 to 8.2), respectively, among those 60 years of age or older and by a factor of 21.7 (95% CI, 10.6 to 44.2) and 3.7 (95% CI, 1.3 to 10.2) among those 40 to 59 years of age. The adjusted rate difference in the primary and secondary analyses was 5.4 and 1.9 cases of severe illness per 100,000 person-days among those 60 years of age or older and 0.6 and 0.1 among those 40 to 59 years of age. Among those 60 years of age or older, mortality was lower by a factor of 14.7 (95% CI, 10.0 to 21.4) in the primary analysis and 4.9 (95% CI, 3.1 to 7.9) in the secondary analysis. The adjusted rate difference in the primary and secondary analyses was 2.1 and 0.8 deaths per 100,000 person-days. CONCLUSIONS Across the age groups studied, rates of confirmed Covid-19 and severe illness were substantially lower among participants who received a booster dose of the BNT162b2 vaccine than among those who did not.
Hatton I. A., Heneghan R. F., Bar-On Y. M. & Galbraith E. D.
(2021)
Science advances.
7,
46,
eabh3732.
It has long been hypothesized that aquatic biomass is evenly distributed among logarithmic body mass size classes. Although this community structure has been observed regionally, mostly among plankton groups, its generality has never been formally tested across all marine life over the global ocean, nor have the impacts of humans on it been globally assessed. Here, we bring together data at the global scale to test the hypothesis from bacteria to whales. We find that biomass within most order of magnitude size classes is indeed remarkably constant, near 1 gigatonne (Gt) wet weight (1015 g), but bacteria and large marine mammals are markedly above and below this value, respectively. Furthermore, human impacts appear to have significantly truncated the upper one-third of the spectrum. This dramatic alteration to what is possibly life's largest-scale regularity underscores the global extent of human activities.
Bar-On Y. M., Goldberg Y., Mandel M., Bodenheimer O., Freedman L., Kalkstein N., Mizrahi B., Alroy-Preis S., Ash N., Milo R. & Huppert A.
(2021)
New England Journal of Medicine.
385,
15,
p. 1393-1400
BACKGROUND On July 30, 2021, the administration of a third (booster) dose of the BNT162b2 messenger RNA vaccine (Pfizer-BioNTech) was approved in Israel for persons who were 60 years of age or older and who had received a second dose of vaccine at least 5 months earlier. Data are needed regarding the effect of the booster dose on the rate of confirmed coronavirus 2019 disease (Covid-19) and the rate of severe illness. METHODS We extracted data for the period from July 30 through August 31, 2021, from the Israeli Ministry of Health database regarding 1,137,804 persons who were 60 years of age or older and had been fully vaccinated (i.e., had received two doses of BNT162b2) at least 5 months earlier. In the primary analysis, we compared the rate of confirmed Covid-19 and the rate of severe illness between those who had received a booster injection at least 12 days earlier (booster group) and those who had not received a booster injection (nonbooster group). In a secondary analysis, we evaluated the rate of infection 4 to 6 days after the booster dose as compared with the rate at least 12 days after the booster. In all the analyses, we used Poisson regression after adjusting for possible confounding factors. RESULTS At least 12 days after the booster dose, the rate of confirmed infection was lower in the booster group than in the nonbooster group by a factor of 11.3 (95% confidence interval [CI], 10.4 to 12.3); the rate of severe illness was lower by a factor of 19.5 (95% CI, 12.9 to 29.5). In a secondary analysis, the rate of confirmed infection at least 12 days after vaccination was lower than the rate after 4 to 6 days by a factor of 5.4 (95% CI, 4.8 to 6.1). CONCLUSIONS In this study involving participants who were 60 years of age or older and had received two doses of the BNT162b2 vaccine at least 5 months earlier, we found that the rates of confirmed Covid-19 and severe illness were substantially lower among those who received a booster (third) dose of the BNT162b2 vaccine.
Sender R., Bar-On Y. M., Gleizer S., Bernshtein B., Flamholz A., Phillips R. & Milo R.
(2021)
Proceedings of the National Academy of Sciences of the United States of America.
118,
25,
e202481511.
Quantitatively describing the time course of the severe acute respiratory syndrome coronavirus 2 (SARS-CoV-2) infection within an infected individual is important for understanding the current global pandemic and possible ways to combat it. Here we integrate the best current knowledge about the typical viral load of SARS-CoV-2 in bodily fluids and host tissues to estimate the total number and mass of SARS-CoV-2 virions in an infected person. We estimate that each infected person carries 109 to 1011 virions during peak infection, with a total mass in the range of 1 μg to 100 μg, which curiously implies that all SARS-CoV-2 virions currently circulating within human hosts have a collective mass of only 0.1 kg to 10 kg. We combine our estimates with the available literature on host immune response and viral mutation rates to demonstrate how antibodies markedly outnumber the spike proteins, and the genetic diversity of virions in an infected host covers all possible single nucleotide substitutions.
Elhacham E., Ben-Uri L., Grozovski J., Bar-On Y. M. & Milo R.
(2020)
Nature.
588,
7838,
p. 442-444
Humanity has become a dominant force in shaping the face of Earth(1-9). An emerging question is how the overall material output of human activities compares to the overall natural biomass. Here we quantify the human-made mass, referred to as 'anthropogenic mass', and compare it to the overall living biomass on Earth, which currently equals approximately 1.1 teratonnes(10,11). We find that Earth is exactly at the crossover point; in the year 2020 (+/- 6), the anthropogenic mass, which has recently doubled roughly every 20 years, will surpass all global living biomass. On average, for each person on the globe, anthropogenic mass equal to more than his or her bodyweight is produced every week. This quantification of the human enterprise gives a mass-based quantitative and symbolic characterization of the human-induced epoch of the Anthropocene.
Gleizer S., Bar-On Y. M., Ben-Nissan R. & Milo R.
(2020)
Cell Reports Physical Science.
1,
10,
100223.
Summary Humanity is facing two major challenges the need to feed a growing population with limited land and freshwater resources and global warming, caused by anthropogenic greenhouse gas emissions. The capture of CO2 from the atmosphere and its subsequent utilization lies at the heart of these challenges. Biological systems for CO2 conversion to organic molecules present a promising avenue due to their high product specificity and modularity. The possibility of combining renewable-energy-harvesting systems along with synthetic-CO2-using microorganisms is especially promising. In this article, we discuss recent major advances in engineering microbes to use CO2 and other one-carbon molecules as the feedstock. We portray the gap in cost that integrated abiotic-biotic systems for CO2 conversion should close to become cost competitive by using the techno-economic data of algae as an existing reference solution.
Davidi D., Shamshoum M., Guo Z., BarOn Y. M., Prywes N., Oz A., Jablonska J., Flamholz A., Wernick D. G., Antonovsky N., Pins B., Shachar L., Hochhauser D., Peleg Y., Albeck S., Sharon I., MuellerCajar O. & Milo R.
(2020)
The EMBO Journal.
39,
18,
e104081.
CO 2 is converted into biomass almost solely by the enzyme rubisco. The poor carboxylation properties of plant rubiscos have led to efforts that made it the most kinetically characterized enzyme, yet these studies focused on < 5% of its natural diversity. Here, we searched for fastcarboxylating variants by systematically mining genomic and metagenomic data. Approximately 33,000 unique rubisco sequences were identified and clustered into ≈ 1,000 similarity groups. We then synthesized, purified, and biochemically tested the carboxylation rates of 143 representatives, spanning all clusters of formII and formII /III rubiscos. Most variants (> 100) were active in vitro , with the fastest having a turnover number of 22 ± 1 s−1sixfold faster than the median plant rubisco and nearly twofold faster than the fastest measured rubisco to date. Unlike rubiscos from plants and cyanobacteria, the fastest variants discovered here are homodimers and exhibit a much simpler folding and activation kinetics. Our pipeline can be utilized to explore the kinetic space of other enzymes of interest, allowing us to get a better view of the biosynthetic potential of the biosphere.
Tsypin L. M., Saunders S. H., Bar-On Y., Leadbetter J. R. & Newman D. K.
(2020)
Microbiology Resource Announcements.
9,
32,
e00695020.
We grew a soil enrichment culture to identify organisms that anaerobically oxidize phenazine-1-carboxylic acid. A strain of Citrobacter portucalensis was isolated from this enrichment and sequenced by both Illumina and PacBio technologies. It has a genome with a length of 5.3 Mb, a G+C content of 51.8%, and at least one plasmid.
Bar-On Y. M., Flamholz A., Phillips R. & Milo R.
(2020)
eLife.
9,
e57309.
The current SARS-CoV-2 pandemic is a harsh reminder of the fact that, whether in a single human host or a wave of infection across continents, viral dynamics is often a story about the numbers. In this snapshot, our aim is to provide a one-stop, curated graphical source for the key numbers that help us understand the virus driving our current global crisis. The discussion is framed around two broad themes: 1) the biology of the virus itself and 2) the characteristics of the infection of a single human host. Our one-page summary provides the key numbers pertaining to SARS-CoV-2, based mostly on peer-reviewed literature. The numbers reported in summary format are substantiated by the annotated references below. Readers are urged to remember that much uncertainty remains and knowledge of this pandemic and the virus driving it is rapidly evolving. In the paragraphs below we provide \u201cback of the envelope\u201d calculations that exemplify the insights that can be gained from knowing some key numbers and using quantitative logic. These calculations serve to improve our intuition through sanity checks, but do not replace detailed epidemiological analysis.
Obtaining a quantitative global picture of life in the great expanses of the oceans is a challenging task. By integrating data from across existing literature, we provide a comprehensive view of the distribution of marine biomass between taxonomic groups, modes of life, and habitats.
Gleizer S., Ben-Nissan R., Bar-On Y. M., Antonovsky N., Noor E., Zohar Y., Jona G., Krieger E., Shamshoum M., Bar-Even A. & Milo R.
(2019)
Cell.
179,
6,
p. 1255-1263
The living world is largely divided into autotrophs that convert CO2 into biomass and heterotrophs that consume organic compounds. In spite of widespread interest in renewable energy storage and more sustainable food production, the engineering of industrially relevant heterotrophic model organisms to use CO2 as their sole carbon source has so far remained an outstanding challenge. Here, we report the achievement of this transformation on laboratory timescales. We constructed and evolved Escherichia coli to produce all its biomass carbon from CO2. Reducing power and energy, but not carbon, are supplied via the one-carbon molecule formate, which can be produced electrochemically. Rubisco and phosphoribulokinase were co-expressed with formate dehydrogenase to enable CO2 fixation and reduction via the Calvin-Benson-Bassham cycle. Autotrophic growth was achieved following several months of continuous laboratory evolution in a chemostat under intensifying organic carbon limitation and confirmed via isotopic labeling.
Flamholz A., Prywes N., Moran U., David D., Bar-On Y. M., Oltrogge L. M., Alves R., Savage D. & Milo R.
(2019)
Biochemistry.
58,
31,
p. 3365-3376
Rubisco is the primary carboxylase of the Calvin cycle, the most abundant enzyme in the biosphere, and one of the best-characterized enzymes. On the basis of correlations between Rubisco kinetic parameters, it is widely posited that constraints embedded in the catalytic mechanism enforce trade-offs between CO2 specificity, S-C/O, and maximum carboxylation rate, k(cat,C). However, the reasoning that established this view was based on data from approximate to 20 organisms. Here, we re-examine models of trade-offs in Rubisco catalysis using a data set from approximate to 300 organisms. Correlations between kinetic parameters are substantially attenuated in this larger data set, with the inverse relationship between k(cat,C) and S-C/O being a key example. Nonetheless, measured kinetic parameters display extremely limited variation, consistent with a view of Rubisco as a highly constrained enzyme. More than 95% of k(cat,C) values are between 1 and 10 s(-1), and no measured k(cat,C) exceeds 15 s(-1). Similarly, S-C/O varies by only 30% among Form I Rubiscos and
Bar-On Y. M. & Milo R.
(2019)
Nature Reviews Microbiology.
17,
4,
p. 199-200
Biofilms are a fundamental form of microbial life and occur in diverse environments, ranging from the mammalian gut to deep subsurface rocks. It is often claimed that most bacteria and archaea live in biofilms, but this claim awaits quantification. Recent updates on global microbial cell numbers prompt a revisiting of this question.
Bar-On Y. M. & Milo R.
(2019)
Proceedings of the National Academy of Sciences of the United States of America.
116,
10,
p. 4738-4743
Photosynthetic carbon assimilation enables energy storage in the living world and produces most of the biomass in the biosphere. Rubisco (D-ribulose 1,5-bisphosphate carboxylase/oxygenase) is responsible for the vast majority of global carbon fixation and has been claimed to be the most abundant protein on Earth. Here we provide an updated and rigorous estimate for the total mass of Rubisco on Earth, concluding it is approximate to 0.7 Gt, more than an order of magnitude higher than previously thought. We find that > 90% of Rubisco enzymes are found in the approximate to 2 x 10(14) m(2) of leaves of terrestrial plants, and that Rubisco accounts for approximate to 3% of the total mass of leaves, which we estimate at approximate to 30 Gt dry weight. We use our estimate for the total mass of Rubisco to derive the effective time-averaged catalytic rate of Rubisco of approximate to 0.03 s(-1) on land and approximate to 0.6 s(-1) in the ocean. Compared with the maximal catalytic rate observed in vitro at 25 degrees C, the effective rate in the wild is approximate to 100-fold slower on land and sevenfold slower in the ocean. The lower ambient temperature, and Rubisco not working at night, can explain most of the difference from laboratory conditions in the ocean but not on land, where quantification of many more factors on a global scale is needed. Our analysis helps sharpen the dramatic difference between laboratory and wild environments and between the terrestrial and marine environments.
Strauss S. K., Schirman D., Jona G., Brooks A. N., Kunjapur A. M., Nguyen Ba A. N., Flint A., Solt A., Mershin A., Dixit A., Yona A. H., Csörgő B., Busby B. P., Hennig B. P., Pál C., Schraivogel D., Schultz D., Wernick D. G., Agashe D., Levi D., Zabezhinsky D., Russ D., Sass E., Tamar E., Herz E., Levy E. D., Church G. M., Yelin I., Nachman I., Gerst J. E., Georgeson J. M., Adamala K. P., Steinmetz L. M., Rübsam M., Ralser M., Klutstein M., Desai M. M., Walunjkar N., Yin N., Hefetz N. A., Jakimo N., Snitser O., Adini O., Kumar P., Smith R. S. H., Zeidan R., Hazan R., Rak R., Kishony R., Johnson S., Nouriel S., Vonesch S. C., Foster S., Dagan T., Wein T., Karydis T., Wannier T. M., Stiles T., Olin-Sandoval V., Mueller W. F., Bar-On Y. M., Dahan O. & Pilpel Y.
(2019)
PLoS Biology.
17,
3,
e3000182.
In experimental evolution, scientists evolve organisms in the lab, typically by challenging them to new environmental conditions. How best to evolve a desired trait? Should the challenge be applied abruptly, gradually, periodically, sporadically? Should one apply chemical mutagenesis, and do strains with high innate mutation rate evolve faster? What are ideal population sizes of evolving populations? There are endless strategies, beyond those that can be exposed by individual labs. We therefore arranged a community challenge, Evolthon, in which students and scientists from different labs were asked to evolve Escherichia coli or Saccharomyces cerevisiae for an abiotic stresslow temperature. About 30 participants from around the world explored diverse environmental and genetic regimes of evolution. After a period of evolution in each lab, all strains of each species were competed with one another. In yeast, the most successful strategies were those that used mating, underscoring the importance of sex in evolution. In bacteria, the fittest strain used a strategy based on exploration of different mutation rates. Different strategies displayed variable levels of performance and stability across additional challenges and conditions. This study therefore uncovers principles of effective experimental evolutionary regimens and might prove useful also for biotechnological developments of new strains and for understanding natural strategies in evolutionary arms races between species. Evolthon constitutes a model for community-based scientific exploration that encourages creativity and cooperation.
Bar-On Y. M., Phillips R. & Milo R.
(2018)
Proceedings Of The National Academy Of Sciences Of The United States Of America-Biological Sciences.
115,
25,
p. 6506-6511
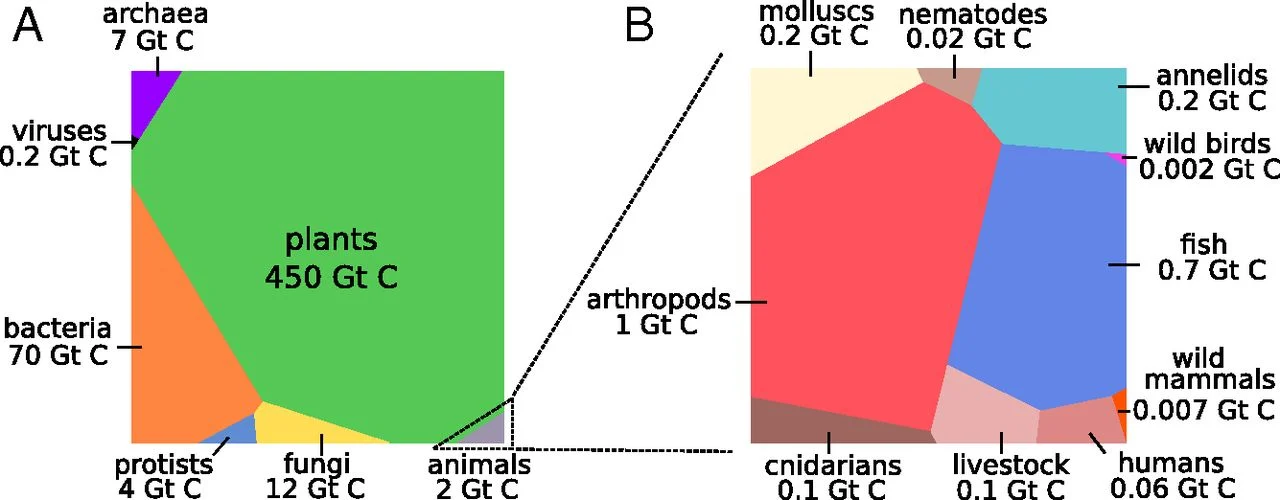
A census of the biomass on Earth is key for understanding the structure and dynamics of the biosphere. However, a global, quantitative view of how the biomass of different taxa compare with one another is still lacking. Here, we assemble the overall biomass composition of the biosphere, establishing a census of the ≈550 gigatons of carbon (Gt C) of biomass distributed among all of the kingdoms of life. We find that the kingdoms of life concentrate at different locations on the planet; plants (≈450 Gt C, the dominant kingdom) are primarily terrestrial, whereas animals (≈2 Gt C) are mainly marine, and bacteria (≈70 Gt C) and archaea (≈7 Gt C) are predominantly located in deep subsurface environments. We show that terrestrial biomass is about two orders of magnitude higher than marine biomass and estimate a total of ≈6 Gt C of marine biota, doubling the previous estimated quantity. Our analysis reveals that the global marine biomass pyramid contains more consumers than producers, thus increasing the scope of previous observations on inverse food pyramids. Finally, we highlight that the mass of humans is an order of magnitude higher than that of all wild mammals combined and report the historical impact of humanity on the global biomass of prominent taxa, including mammals, fish, and plants.
Herz E., Antonovsky N., Bar-On Y., Davidi D., Gleizer S., Prywes N., Noda-Garcia L., Lyn Frisch K., Zohar Y., Wernick D. G., Savidor A., Barenholz U. & Milo R.
(2017)
Nature Communications.
8,
1,
1705.
Understanding the evolution of a new metabolic capability in full mechanistic detail is challenging, as causative mutations may be masked by non-essential "hitchhiking" mutations accumulated during the evolutionary trajectory. We have previously used adaptive laboratory evolution of a rationally engineered ancestor to generate an Escherichia coli strain able to utilize CO2 fixation for sugar synthesis. Here, we reveal the genetic basis underlying this metabolic transition. Five mutations are sufficient to enable robust growth when a non-native Calvin-Benson-Bassham cycle provides all the sugar-derived metabolic building blocks. These mutations are found either in enzymes that affect the efflux of intermediates from the autocatalytic CO2 fixation cycle toward biomass (prs, serA, and pgi), or in key regulators of carbon metabolism (crp and ppsR). Using suppressor analysis, we show that a decrease in catalytic capacity is a common feature of all mutations found in enzymes. These findings highlight the enzymatic constraints that are essential to the metabolic stability of autocatalytic cycles and are relevant to future efforts in constructing non-native carbon fixation pathways.
Barenholz U., Davidi D., Reznik E., Bar-On Y., Antonovsky N., Noor E. & Milo R.
(2017)
eLife.
6,
20667.
A set of chemical reactions that require a metabolite to synthesize more of that metabolite is an autocatalytic cycle. Here, we show that most of the reactions in the core of central carbon metabolism are part of compact autocatalytic cycles. Such metabolic designs must meet specific conditions to support stable fluxes, hence avoiding depletion of intermediate metabolites. As such, they are subjected to constraints that may seem counter-intuitive: the enzymes of branch reactions out of the cycle must be overexpressed and the affinity of these enzymes to their substrates must be relatively weak. We use recent quantitative proteomics and fluxomics measurements to show that the above conditions hold for functioning cycles in central carbon metabolism of E. coli. This work demonstrates that the topology of a metabolic network can shape kinetic parameters of enzymes and lead to seemingly wasteful enzyme usage.
Antonovsky N., Gleizer S., Noor E., Zohar Y., Herz E., Barenholz U., Zelcbuch L., Amram S., Wides A., Tepper N., Davidi D., Bar-On Y., Bareia T., Wernick D. G., Shani I., Malitsky S., Jona G., Bar-Even A. & Milo R.
(2016)
Cell.
166,
1,
p. 115-125
Can a heterotrophic organism be evolved to synthesize biomass from CO2 directly? So far, non-native carbon fixation in which biomass precursors are synthesized solely from CO2 has remained an elusive grand challenge. Here, we demonstrate how a combination of rational metabolic rewiring, recombinant expression, and laboratory evolution has led to the biosynthesis of sugars and other major biomass constituents by a fully functional Calvin-Benson-Bassham (CBB) cycle in E. coli. In the evolved bacteria, carbon fixation is performed via a non-native CBB cycle, while reducing power and energy are obtained by oxidizing a supplied organic compound (e.g., pyruvate). Genome sequencing reveals that mutations in flux branchpoints, connecting the non-native CBB cycle to biosynthetic pathways, are essential for this phenotype. The successful evolution of a non-native carbon fixation pathway, though not yet resulting in net carbon gain, strikingly demonstrates the capacity for rapid trophic-mode evolution of metabolism applicable to biotechnology.
Murphy M., Clare E. L., Rydell J., Yovel Y., Bar-On Y., Oelbaum P. & Fenton M. B.
(2016)
Acta Chiropterologica.
18,
1,
p. 209-213
The evolution of cue reception and cue production is well documented. The ability of species to use cues they did not evolve with is important in understanding flexibility in behaviour. We observed Neotropical nectar-feeding bats (Glossophaga soricina) feeding at Old World banana flowers (Musa acuminata) in a Belize garden. The flowers produce a rich source of nectar that is exposed as a bract lifts before dusk. We tested the hypothesis that the bracts serve as beacons to foraging bats and discuss this approach and the use of acoustic information by bats feeding at flowers. We ensonified a bract with cues like those of echolocating G. soricina, which revealed the production of strong echoes from the bract. Additionally, the removal of bracts from the flowers influenced the bats' flower-visiting behaviour. We suggest that the bats use the echoes from the bract opportunistically as a cue to find the nectar source. Our findings provide an example of an interaction between a plant and flower visitor not reflecting a shared evolutionary past.
Shamir M., Bar-On Y., Phillips R. & Milo R.
(2016)
Cell.
164,
6,
p. 1302-1302.e1
Knowing key timescales enables us to quickly gain intuition, perform sanity checks and serves as a sixth sense in understanding how cells grow and communicate. This SnapShot briefly communicates some of the insights we collected about rates and durations of these processes from thinking about cell biology by the numbers.
Boonman A., Bar-On Y., Cvikel N. & Yovel Y.
(2013)
Frontiers in Physiology.
4 SEP,
Article 24.
Around 1000 species of bats in the world use echolocation to navigate, orient, and detect insect prey. Many of these bats emerge from their roost at dusk and start foraging when there is still light available. It is however unclear in what way and to which extent navigation, or even prey detection in these bats is aided by vision. Here we compare the echolocation and visual detection ranges of two such species of bats which rely on different foraging strategies (Rhinopoma microphyllum and Pipistrellus kuhlii). We find that echolocation is better than vision for detecting small insects even in intermediate light levels (1-10 lux), while vision is advantageous for monitoring far-away landscape elements in both species. We thus hypothesize that, bats constantly integrate information acquired by the two sensory modalities. We suggest that during evolution, echolocation was refined to detect increasingly small targets in conjunction with using vision. To do so, the ability to hear ultrasonic sound is a prerequisite which was readily available in small mammals, but absent in many other animal groups. The ability to exploit ultrasound to detect very small targets, such as insects, has opened up a large nocturnal niche to bats and may have spurred diversification in both echolocation and foraging tactics.