Movie Gallery
Dynamics of orientation tuning (differential map)
Visualization of the appearance of orientation patches in cat area 18 in response to a visual presentation of drifting gratings. The difference between the cortical responses to vertical and horizontal gratings is shown (differential maps). Time resolution: 10 msec.
Data by Sharon and Grinvald, Science 2002
Dynamics of Orientation Tuning: polar movie
Data by Sharon and Grinvald, Science 2002
Dynamics of orientation tuning: polar movie plus time course
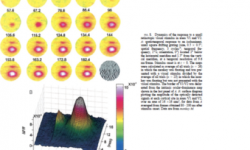
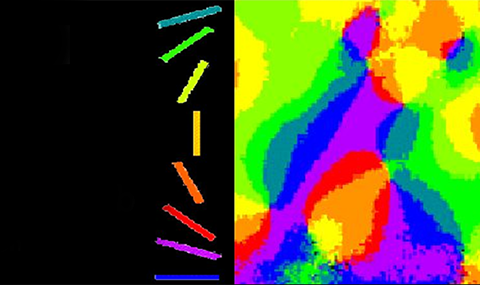
Time-course of the “polar orientation maps”: color represents the preferred orientation of each pixel (ranging 0-180º from bottom to top of color-bar on right), and brightness represents modulation depth of its tuning curve (ranging 0-0.5 ‰ from left to right of colorbar). After peaking at 74 ms, map strength declines gradually to ~65%-maximal at 120 ms (not shown).
Data by Sharon and Grinvald, Science 2002
Lateral spread of activity in the barrel cortex
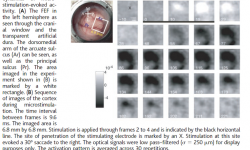
Visualization of the Spatio-temporal dynamics of the response to whisker C3 stimulation using a 3-msec air-puff. Initially activation is seen only in restricted area similar to the whisker representation in layer IV. (Temporal resolution 0.6msec. Average of 128 trials.)
Data by Derdikman et al, JNS 2003
Spread of activity from a single barrel
Data by Derdikman et al, JNS 2003
Surround inhibition in the barrel cortex
The VSD response to strong whisker or cutaneous stimulus is tri-phasic. Visualization of a frame sequence of averaged functional maps depicting depolarization phase followed by surround hyperpolarization phase and a depolarizing rebound. (N = 192 trial; Scale bar is 1 mm.)
Data by Derdikman et al, JNS 2003

Dynamics of Depolarization and Hyperpolarization in the Frontal Cortex and Saccade Goal
Data by Seideman et al, Science 2002

Cortical representation of a small object in primary visual cortex of awake monkey
Data by Slovin et al, JNP 2002

Cortical representations of a small object during saccade in primary visual cortex of awake monkey
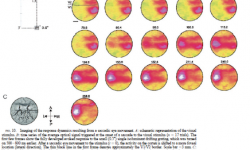
Time series of the average optical responses triggered at the onset of a saccade to the visual stimulus. The first few frames show the fully developed evoked response to the small (0.5 o ) single drifting grating, which was turned on 500 - 800 ms earlier. After a saccadic eye movement to the stimulus (t = 0), the activity on the cortex is shifted to a more foveal location (lateral) (n = 17 trials). The right panel shows the average eye movement during the imaging of cortical responses.
Data by Slovin et al, JNP 2002
Dynamics of cortical states
The left panel displays an sequence of a single frame (10 msec snapshots, without averaging) from a movie showing the instantaneous cortical activity in the absence of stimulation (raw data; not processed). The time relative to the first frame is displayed in the center. Whenever a state that is significantly correlated with one of the orientation maps emerges, that orientation map appears on the right panel, its corresponding orientation is displayed by a bar in the center, and the correlation between the two frames is displayed over the left panel. When the maximal correlation for a state is reached, the movie pauses briefly.
Data by Kenet et al, Nature 2003
The line motion illusion
Small squares (cues) are presented at different locations followed by a bar.
All stimuli shown are flashed AND stationary. However, illusory motion is perceived drawn away from the cue locations to form the full bar.
Data by Jancke et al, Nature 2004
Cortical correlates of the line motion illusion
Optically detected activity within 5.5 x 2.9 mm cortical surface. The first frames show the rapid spread of low amplitude activity (light blue, green, yellow; presumably subthreshold) followed by high-level activity (red, brown; presumably spiking) that gradually propagates towards the end of the cortical bar representation, thus reporting motion within the stationary flashed bar. A drawn bar or a moving square at appropriate speed produce similar spatio-temporal patterns to that observed here with the line-motion stationary stimuli (not shown). (Sampling rate 9.6 ms.)
Data by Jancke et al, Nature 2004


