
The technologies
My colleagues and I research accomplishments include several major technical innovations published in the highest-ranking scientific journals. First, the two optical imaging techniques (1-2); innovation of VSD optical recording with laser light (4); innovation of long-term chronic optical imaging through the thinned skull; innovation of chronic optical imaging and electrical recording via a cranial window in behaving primates. In addition, a complementary laser photo stimulation method was developed (7); innovation of imaging spectroscopy, in vivo (10); the first oxygen tension measurement in the brain, in response to sensory input (11); and a clinical medical device based on 7 patents for (i) measuring blood velocity in small secondary and tertiary vessels (23,24); (ii) noninvasive visualization of capillaries in the human body (21); (iii) measuring oxygen saturation, and (iv) imaging metabolism (25-26).
Detailed report
A. Development of optical imaging techniques
A.1 Real-time optical imaging. This technique is based on vital staining of the cortex with voltage-sensitive dyes and imaging the activity-dependent absorption or fluorescence changes (VSDI). The first feasibility steps in this direction were taken by Dr. I. Tasaki, Dr. L.B. Cohen, and their colleagues. Voltage-sensitive dyes bind externally to neuronal membranes and act as molecular transducers, transforming changes in membrane potential into optical signals. Optical imaging offers great advantages over the already powerful classical electrical recording techniques because the activity is monitored simultaneously by more than a million pixels rather than by monitoring the activity with micro-electrodes.
We made VSDI work for imaging many individual neurons simultaneously starting with invertebrate ganglia (5). His innovations and findings cover the full range of the most useful model preparations in neuroscience, from simple neurons maintained in culture (4) through intact invertebrate ganglia (5), mammalian brain slices, (6) and the intact brain from a frog to the human brain (1,8). In each of these research directions, the efforts were targeted at addressing outstanding open questions that could not be readily resolved by (19), monkeys (8, 14), and humans (8). Our lab showed that activity maps could also be obtained through the intact dura and thinned bone. Repeated chronic optical imaging of the same patch of cortex, over a long period of time, was also developed for behaving monkeys (9), thus establishing that optical imaging will contribute to the exploration of cognitive functions.
A.2. Imaging based on visualization of oxygen delivery: This imaging modality is based on imaging of intrinsic changes in the optical properties of electrically active tissue. One source for the activity-dependent optical signal is a small change in color produced by oxygen delivery from oxy-hemoglobin within the capillaries in response to metabolic demand. Other intrinsic signals originate from activity-dependent light-scattering changes. Because these signals were very small, no one felt that they could be useful for functional imaging. Our expertise in “seeing the invisible” finally facilitated the first imaging based on these intrinsic signals (2). This imaging technique permitted the high-resolution imaging of the functional architecture of the somatosensory and visual cortices in the living brains of rats, cats (12-19), monkeys (8, 14), and humans (8). My colleagues and I showed that activity maps could also be obtained through the intact dura and thinned bone. Repeated chronic optical imaging of the same patch of cortex, over a long period of time, was also developed for behaving monkeys (9), thus establishing that optical imaging will contribute to the exploration of cognitive functions.

A.3. Exploring the coupling between electrical activity and microcirculation: My colleagues and I extensively characterized the mechanism underlying the coupling between electrical activity and the responses of microcirculation and found that the coupling is highly local much more than was estimated previously (10-11). This pioneering work (2) paved the way 6 years later for two powerful non-invasive techniques to image neuronal activity in the human brain. The first technique, BOLD f-MRI, is based on the very same phenomenon of an activity-dependent change in the hemoglobin oxidation state blood volume and flow (Ogawa et al., 1992; Kwong et al., 1992). The second technique is optical imaging of human brain activity through the intact skull, non-invasively. It is based on our intrinsic signals and was further developed by Tamura and his colleagues (1993) and by Graton et al. (1995, 1997). (Both do not offer real-time resolution, unlike VSDI.)
B. Major findings related to sensory perception
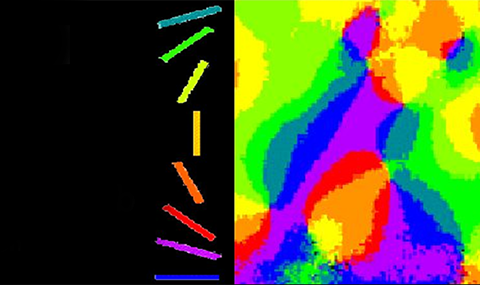
B.1 Functional architecture underlying visual perception: Until our innovation of intrinsic optical imaging, it was impossible to map the functional architecture of the mammalian cortex for multiple parameters. Furthermore, unlike the previous method, 2DG, the animal survived the mapping, thus allowing the study of development and plasticity in response to many manipulations over a long period of time. Mountcastle, Hubel, and Wiesel have found that cortical cells with similar response properties are frequently clustered together, forming columns (modules) that often traverse the entire cortical depth, from pia to the white matter. However, the exact functional architecture (spatial organization) of different functional modules remains unresolved, for all areas of the mammalian cortex. Optical imaging has become a particularly attractive technique for exploring this functional architecture. My colleagues and I research in the cat visual cortex established that the most prominent organizational feature of orientation preference is a radial arrangement, forming a pinwheel-like structure surrounding a singularity point (12). This work resolved a long-standing question, extensively debated among experimentalists and theoreticians lasting more than 30 years. Furthermore, optical imaging resolved other long-standing controversies. It has been established that directional selectivity and spatio-temporal frequency (13) are also organized in patchy mosaics. Furthermore, a set of geometrical rules was found, defining the relationship between the layouts of mosaics corresponding to columnar functional domains performing different computational tasks (13). My colleagues and I proceeded to show that the same elaborate organization, underlying the visual perception of oriented lines or edges, also exists in primates. In addition, the relationships among three underlying perceptions: orientation, depth, and color were explored. Again, the meticulous non-random relationships among the three subsystems were found. This technology is now being used in numerous laboratories for functional mapping prior to patch clamping, 2-P imaging, tracer injections, and virus injections. The long journey of charting the cerebral cortex has continued. It has been expanded by my colleagues and I to higher cortical areas (9, 14), other sensory modalities, and other species, culminating in the human cortex (8).
B.2. The large lateral spread of sub-threshold synaptic activation explains visual illusion: Cortical studies over many years have led to a mapping of the representation of sensory input in the cortex. For example, if a single whisker is gently touched, electrical activity is created only in a specific part of the somatosensory cortex called whisker barrel. Thus, the somatosensory cortex map actually looks like the whole human body (homunculus). A similar discrete spatial representation has been reported for the visual cortex. Small visual stimuli activate a small cortical patch (retinotopic representation) and a given auditory tone activates a small region in the primary auditory cortex. Electrical activity in these areas can be divided into two categories: action potentials are revealed mostly in the classical representation and sub-threshold activity location. It is important to remember that until the late 1970s with the accepted means of research, subthreshold activity was not discernible at high resolution, and without its characterization in time and space, it is impossible to understand the basic principles of the brain's remarkable performance. Using optical imaging based on voltage-sensitive dyes (VSDI) that are also sensitive to subthreshold activity, my colleagues and I found that subthreshold activity extends far beyond the location of the classical representation, both in the frog optic tectum and in the primate brain (The evoked electrical activity can be divided into two types: the suprathreshold activity of action potentials and subthreshold activity, which is too small to trigger action potentials. Using VSDI, which is most sensitive of the sub-threshold synaptic potentials, my colleagues and I surprisingly found that the subthreshold activity spreads far beyond the region of suprathreshold action potentials (1). By mapping the spreading subthreshold activity evoked by a stationary stimulus, his team was able to explain the neuronal basis underlying the illusionary perception of motion when the subjects viewed are stationary images (19).
B.3. The importance of population activity: Our method of optical imaging in real time enabled (17) to discover the significant interdependence existing between the average activity of a single neuron measured by an electrode repeatedly and the activity of a cell population. This is important since the activity of a single cell does not always provide repeatable information that population activities can provide. By combining electrical recording, VSDI, and the spike-triggered averaging technique, spatial patterns of neuronal assemblies per se could be imaged
B.3. The dynamic patterns of activity in neuronal assemblies: ongoing activity. The application of optical imaging for visualizing dynamic patterns of population activity was reported in 1982 for brain slices (6) and in 1984 for the intact frog brain (1). These novel applications demonstrated that optical imaging can provide information not easily achievable by alternative approaches. Cortical processing of transformed retinal images is performed in the myriad dendritic arborizations of individual cortical neurons. In cortical tissue, real-time imaging, based on voltage-sensitive-dyes, also reflects the inputs impinging on the fine dendrites of cortical cells. The question of whether the primary visual cortex processes information in a strict retinotopic manner was explored. The cortical point-spread function was directly visualized, that is, how a point retinal image is represented at the visual cortex. The extensive lateral spread, beyond the retinotopic border, which they imaged, indicated that the degree of distributed processing in the primary visual cortex is much larger than previously estimated. After the successful design of suitable voltage-sensitive dyes to explore the mammalian brain, the dynamics of shape processing resolved a long-lasting controversy (15), and neuronal correlates related to the perception of visual illusions were found in early visual areas, suggesting a significant bottom-up contribution to the origin of this perceptual illusion (19). My colleagues and I showed that neuronal assemblies performing a specific computational task can be selectively visualized as well (3). These findings indicate that some recurring patterns of ongoing internal brain waves are an intrinsic property of the cortex and must play an important role in sensory processing (16-18). This pioneering finding was confirmed with numerous studies of FMRI and EEG in humans. A more recent study discovered the complementary effect, namely, that sensory stimuli diminished the ongoing activity (18a). These papers have been cited more than 2500 times (GS). These exciting findings underscore the importance of ongoing activity pointed out by the previous papers.
B.4. Medical applications
The medical applications were a direct result of our basic fundamental research. Seven patents related to differential functional optical imaging with applications to ophthalmology, endoscopy and cardiology emerged.
Guided neurosurgery: My colleagues and I utilized optical imaging based on intrinsic signals for the functional brain mapping of human patients for delineating functional borders and navigation during neurosurgery prior to tumor removal. These clinical studies were carried out at Memorial Sloan-Kettering Cancer Center (New York) and at Rabin Medical Center Hospital. They successfully imaged hand representations in the somatosensory cortex (8). Intrinsic imaging was used during neurosurgery in several medical centers in the US (Haglund et al., 1992) and Japan. Later this application was not pursued further because it was replaced by f-MRI.
The retinal function imager: In the last decade (21-26), My Company Optical Imaging Ltd has brought years of experience in imaging small-signal reflecting biological activity, that is, “seeing the invisible,” to clinical applications. He started with early diagnostics in ophthalmology, offering a new tool for early diagnosis of retinal diseases. His Retinal Function Imaging (RFI) provides four (25) unique advantages, all of them noninvasive: (a) retinal metabolic responses to functional activation; (b) retinal blood flow, at the level of individual red blood cells in fine retinal microcirculation – from small veins and arteries down to capillaries (micro-angiography); (c) retinal oximetric state (d) mapping invisible capillaries without any contrast agents, (e|) visualization of choroid vessels without contrast agent injection (22).
Noninvasive visualization of capillaries: Capillaries are the major compartment of blood circulation, providing essential nutrients to any surrounding tissue and collecting its waste products. Therefore, assessment of capillary abnormality is desirable for early diagnosis, treatment, and follow-up for common pathologies ranging from retinal disease, vascular diseases to cancer. Capillaries themselves are transparent, thus injected contrast agents such as fluorescein were widely used to visualize them. Fluorescein injection, however, is often confounded by side effects (sometimes serious). The RFI uses hemoglobin as an intrinsic motion-contrast agent to generate detailed capillary perfusion maps, non-invasively. Non-invasive capillary perfusion maps (nCPM) thus obtained, revealed microvascular details in far greater detail than did the gold standard invasive fluorescein angiography images, as confirmed by an independent study (Witkin et al., AJO 2012). The retinal application of this approach is non-invasive, comfortable, and safe; it is repeatable as often as required for early diagnosis, treatment guidance, and follow-up. The same capillary perfusion map imaging and analysis principles can be applied to any organ of the body available for visualization via endoscopy or via micro endoscopy.
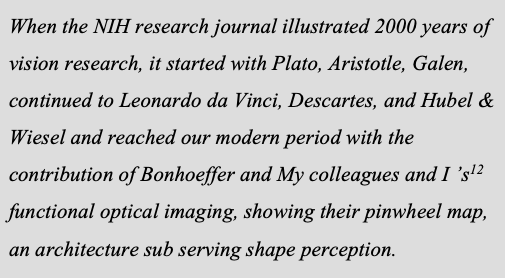
Optical Imaging ltd retinal function imager (RFI) is currently the only integrated ophthalmic device providing up to 13 functional and structural parameters. In the following figure one can see results of angiography, oximetry and blood velocity measurements
The parameters quantitatively measured and analyzed by RFI also include all the classical parameters obtained with a gold standard fundus camera including the following: (1) Blood velocity; (2) Diameter; (3) Blood flow; (4) nCPM =Non-invasive angiography-like imaging of the microvessel & capillaries; (5) Quantitative oximetry in small microvessels (see appendices regarding identification of small vessel types; (6) Functional metabolic signal; (7) Functional imaging of electrical activity in the retinal nerve fiber (RNFL); (8) Imaging the choroid non-invasively; (9) Color image; (10) BW image; (11) FA angiography; (12) ICG angiography; (13) Autofluorescence.
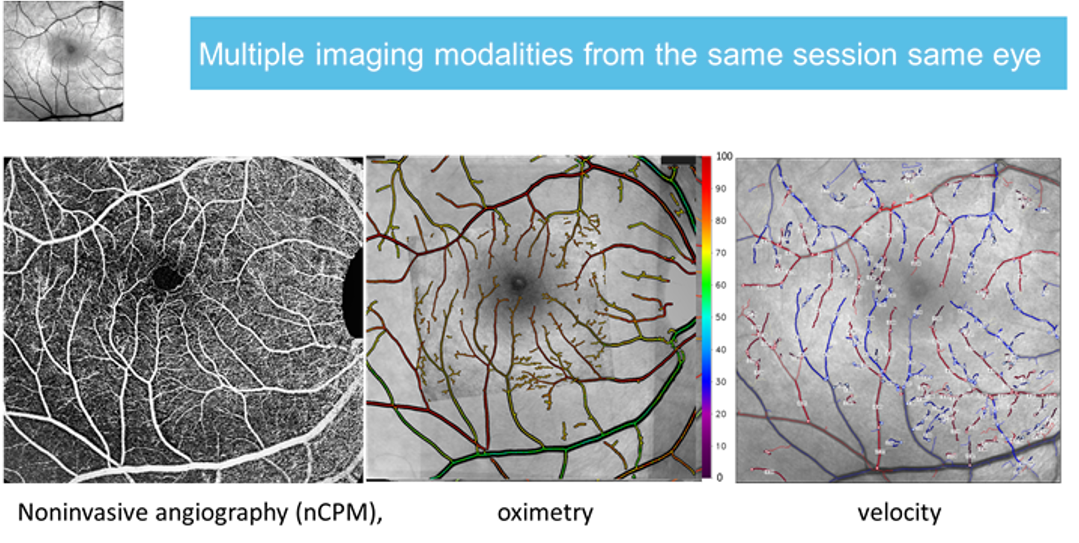
The quality of the capillary maps obtained by RFI is superior to the invasive 70 years old gold standard of fluorescein angiography as depicted in the figure below.
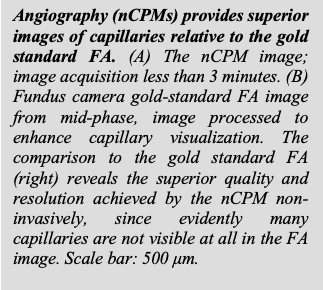
Angiography (nCPMs) provides superior images of capillaries relative to the gold standard FA. (A) The nCPM image; image acquisition less than 3 minutes. (B) Fundus camera gold-standard FA image from mid-phase, image processed to enhance capillary visualization. The comparison to the gold standard FA (right) reveals the superior quality and resolution achieved by the nCPM non-invasively, since evidently many capillaries are not visible at all in the FA image. Scale bar: 500 μm.
Major Findings: (i) The transition from diabetes to diabetic retinopathy: Blood velocity in diabetes subjects is faster than in normal subjects as long as they do not suffer any retinopathy. In contrast, in patients with diabetic retinopathy the blood velocity is slower than in normal subjects23, 24. Taken together, these findings may be used for screening diabetes and finding the transition point of the diabetic retinopathy onset prior to damage to the retina and for starting preventive treatment at the earliest possible time before irreversible damage occurs. (ii) After Avastin injection to AMD patients, the flow velocity determined by RFI can serve as a marker, depending on whether the injection was effective. (iii) The functional metabolic signal is a good marker for induced glaucoma.
Present focus and future potential of the technology: Because the eye can often serve as a “window” to the entire body, risk assessment can be accomplished through the eye. Under My colleagues and I ’s scientific and technology leadership, Optical Imaging Ltd is beginning to use the platform technology for diagnosis of other diseases related to vascular diseases, which the scientific literature indicates can be detected in the eye. These diseases include (i) Cerebral Vascular Accident (CVA), one of the top 3 causes of death in the USA (730,000/y). Cerebral Vascular diagnosis “through the eye” is a non-invasive evaluation of the state of blood vessel functions within the eye and can serve as an indication for a potential stroke (CVA), multiple sclerosis, and Alzheimer’s, which are also studied through the eye (26). (ii). Cardio Vascular Disease (CVD) affects 81 million Americans. Cardiology “through the eye” – a non-invasive evaluation of the manifestations of atherosclerosis of the eye’s blood vessels serves as an indication of the coronary arteries’ pathological state.
Direct functional imaging of other organs of the human body: The optical imaging platform technology is obviously applicable to any organ of the body, provided that it can be imaged with an endoscope or micro-endoscope. Therefore, there are numerous applications of this technology platform including (i) Screening vascular related drugs during their development, (ii) Personalized medicine – tailoring a given drug to individual patients’ needs with respect to the drug type, treatment interval, dose etc., since a large variability in a patient’s responses to drug treatment has been observed. More than 100,000 Americans die each year from adverse drug reactions (ADR), and millions more suffer from none or poor drug treatment, resulting from the drug dosage not optimized for the patient’s personal physiological properties. (iii) Endoscopy for early detection of colon cancer based on detection of capillaries’ neo-vascularization.
Summary: My colleagues and I have innovated unique technologies and has excelled in employing them in basic research. His findings led to new concepts in neuroscience that should change how scientists view brain function. This contribution has been recognized by his receiving many prizes (CV). My colleagues and I wrote patents, built a company, and then together with his limited team build an FDA-approved sophisticated medical device, which already is being utilized in dozens of hospitals. All the largest ophthalmic companies including Karl Zeiss, Topcon, Cannon, Nidek, OptoView, Heidelberg Instruments, and more have now placed their devices for non-invasive angiography pioneered by - in thousands of hospitals worldwide.
Selected References
- Grinvald, Anglister, Freeman, Hildesheim & Maker (1984) Real time optical imaging of naturally evoked electrical activity in the intact frog brain. Nature, 308, 848-850.
- Grinvald, Lieke, Frostig, Gilbert & Wiesel (1986) Functional architecture of cortex revealed by optical imaging of intrinsic signals. Nature, 324, 361-364.
- Arieli, Shoham, Hildesheim and Grinvald (1995) Coherent spatio-temporal pattern of on-going activity revealed by real time optical imaging coupled with single unit recording in the cat visual cortex. J. Neurophysiol. 73, 2072-2093.
- Grinvald & Farber (1981) Optical recording of calcium action potentials from growth cones of cultures neurons using a laser microbeam. Science 212, 1164-1166.
- Grinvald & Cohen (1977) Simultaneous recording from several neurons in an invertebrate central nervous system. Nature 268, 140.
- Grinvald, Maker & Segal (1982) Visualization of the spread of electrical activity in rat hippocampal slices by voltage-sensitive optical probes. J. Physiol. 333, 269-291.
- Farber I. and A. Grinvald (1983). Identification of presynaptic neurons by laser photostimulation. Science, 222, 1025-1027.\
- Shoham D. & A. Grinvald A. (2001). Visualization of the hand representation in the hand in macaque and human area S-I using intrinsic signal optical imaging. J. Neuroscience, 21:6820-6835.
- Seidemann E, Arieli A, Grinvald A, Slovin H. (2002). Dynamics of depolarization and hyperpolarization in the frontal cortex and saccade goal. Science, 295(5556):862-865.
- Malonek and A. Grinvald (1996). Interactions between electrical activity and cortical microcirculation revealed by imaging spectroscopy; implications for functional brain imaging. Science, 72, 551-554.
- Vanzetta I. & A. Grinvald (1999). Cortical activity-dependent oxidative metabolism revealed by direct oxygen tension measurements; implications for functional brain imaging. Science, 286,1555-58.
- Bonhoeffer & Grinvald (1991). Iso-orientation domains in cat visual cortex are arranged in pinwheel like patterns. Nature, 353, 429-431.
- Shoham*, D., Hubener*, M., Grinvald A., & Bonhoeffer, T. (1997). Spatio-temporal frequency domains and their relationship to cytochrome oxidase staining in cat visual cortex. Nature 385, 529-534.
- Ts'o, Frostig, Lieke & Grinvald (1990). Functional Architecture of Primate Visual Cortex revealed by High resolution optical imaging. Science, 249,417-420.
- Sharon D, Grinvald A. (2002). Dynamics and constancy in cortical spatiotemporal patterns of orientation processing. Science, 295, 512-515.
- Arieli, A Sterkin, A. Grinvald, & A. Aertsen (1996). Dynamics of on-going activity: Explanation of the large in variability in evoked cortical responses. Science, 273, 1868-1871.
- Tsodyks M., T. Kenet, A. Grinvald and A. Arieli (1999). The spontaneous activity of single cortical neuron depends the underlying global functional architecture. Science, 286, 1943-1946.
- Kenet, T., Bibitchkov D., M. Tsodyks, A. Grinvald, & A. Arieli (2003). Spontaneously occurring cortical representations of visual attributes. Nature, 425, 954-956.
- 18a Deneux T. & Grinvald A. (2017). Milliseconds of sensory input abruptly modulate the dynamics of cortical states for seconds Cerebral Cortex.
- Jancke, D., F. Chavane, S. Naaman A. Grinvald (2004). Imaging cortical correlates of a visual illusion, Nature, 428: 424-427.
- Vanzetta I. & Grinvald A. (2008) Coupling between neuronal activity and microcirculation: implications for functional brain imaging. HFSP JOURNAL, 2, 79-98.
- Nelson, DA. S. Krupsky, A. Pollack, E. Aloni, M. Belkin, I. Vanzetta, R. Mordechai, & A. Grinvald (2005). Noninvasive Multi-parameter Functional Optical Imaging of the Eye. Ophthalmic Surgery, Lasers and Imaging, 36:57-66.
- Darin A. Nelson, Amit Ruf, Oaknin Jacob, Zvia Burgansky-Eliash, Hila Barash, David Izhaky, Anat Lowenstein, Adiel Barak, Elisha Bartov, Tali Rock, & Amiram Grinvald. (2011). Wide-field High-Resolution Imaging of Perfused Capillaries without the Use of Contrast Agent. Clinical Ophthalmology, 5:1095-1106.
- Burgansky-Eliash Z, Nelson DA, Bar-Tal Pupko O, Lowenstein A, Grinvald A, & Barak A. (2010). Reduced Retinal Blood Flow Velocity in Diabetic Retinopathy. Retina 30: 765-773
- Burgansky-Eliash Z, Barak A, Barash H, Nelson DA, Pupko O, Lowenstein A, Grinvald A, & Rubinstein A (2012). Increased retinal blood flow velocity in patients with early diabetes mellitus. Retina. Jan;32(1):112-9.
- Vanzetta, I, Deneux T., & Grinvald, A., High-resolution wide-field optical imaging of micro-vascular characteristics: from the neocortex to the eye (2014). Mingrui Zhao et al. (eds.), Neurovascular Coupling Methods, Neuromethods, vol. 88, Springer Science+Business Media New York 2014.
- Liang Wang, Hong Jiang, Amiram Grinvald, Jayadev Chaitra, & Jianhua Wang (2018). Liang Wang, Hong Jiang, Amiram Grinvald, Jayadev Chaitra, Jianhua Wang (2018). A Mini Review of Clinical and Research Applications of the Retinal Function Imager. Current Eye Research. 43, 273-288