Movies

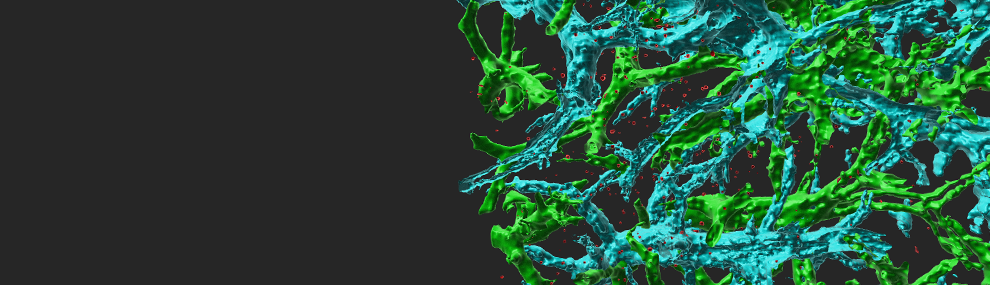
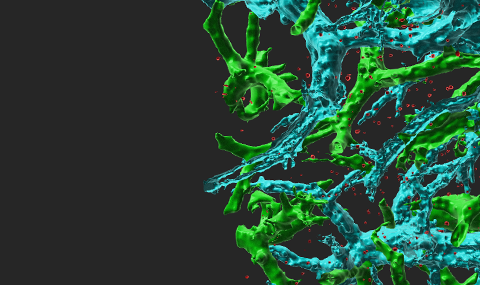
Three-dimensional animated visualization of lungs stained i.v. with anti VCAM-1 (cyan). The autofluorescence signal depicts the bronchial tree. Note the close proximity between the VCAM-1 positive blood vessels and the different bronchioles constituting the bronchial tree.
 cell imaged by LSM")
Three-dimensional animated visualization of a CMTMR labeled B16F10 cell (red) which has exited the CD31-labeled lung vasculature (cyan). Scale bar, 100 μm.
 cell imaged by LSM")
Three-dimensional animated visualization of two CMTMR labeled B16F10 cells (red) located inside a CD31-labeled lung vessels (cyan). Scale bar, 100 μm.
 and their surrounding neutrophils by light sheet microscopy of whole lungs")
Endogenous neutrophils were labeled 5 mins before harvesting the lungs with Alexa 647-labeled anti-Ly6G mAb. Lungs were inflated with low melting temperature agarose, excised and cleared. Autofluorescent lung stromal cells are depicted in green. Bar= 100µm.

A time lapse movie depicting a Hoechst labeled effector T cell crossing through a transcellular route of IL-1b-stimulated HDMVECs expressing RFP-Lifeact. Images were taken 20 sec apart. Elapsed time is designated as h:mm:ss. Bar, 5 μm.

Blue: nucleus. The red line depicts the deformed nucleus and the green line depicts the edge of the leading edge of the transmigrating granulocyte extended underneath the endothelial cell.
 in the process of crossing a confluent monolayer of bEnd3 murine endothelial cells.")
Phase contrast and fluorescence microscopy. Note the very slow generation of a sub-endothelial leading edge by the transmigrating tumor cell followed by a slow squeezing of the tumor nucleus through the endothelial junction.

3D image of lungs imaged by light sheet microscopy (LSM). Recipient mice were injected with 20,000 B16-F10 labeled with CMTMR 1 hour before (red). Green: auto fluorescence of the lung stroma.

3D image of lungs imaged by light sheet microscopy (LSM). Recipient mice were injected with 20,000 B16-F10 labeled with CMTMR 3 hours before. To visualize lung vessels, Alexa 647 conjugated anti CD31 mAb was injected 5 minutes before lungs were harvested, fixed and cleared for LSM imaging.

A dsRed labeled OT-II CD4+ cell (red) interacting with an ICAM-1 and 2 double deficient DC (GFP, green) in the T zone of a popliteal lymph node. WT DCs are CFP labeled. Mice were immunized with αDEC-205-OVA and αCD40 mAb. Bar, 10 μm.

3D image of lungs infected with the virus imaged by light sheet microscopy (LSM) 4 days post infection. The influenza infected airways are depicted in red. Green: auto fluorescence of the lung stroma. Note the high specificity of the virus towards the airways and the large peribronchial vessel (green) surrounding the virus infected bronchi (red).