


MR Spectroscopy (MRS) and MR Spectroscopic Imaging (MRSI) of molecules with hyperpolarized 13C nuclei are promising technique for in-vivo mapping of metabolic information. These methods are based on Dynamic Nuclear Polarization (DNP) followed by a rapid dissolution process to produce a highly polarized metabolic contrast agent. We utilize such methods in a variety of biomolecular and biological investigations, in conjunction with fast acquisition methods that both we and others are developing. The figure on the left shows recent results following the injection of 13C1-pyruvate into muscle subject to an activation protocol. Also visible are pyruvate’s metabolic products 13C1-lactate, 13C1-alanine and 13C1-bicarbonate, mapped using a 3D Chemical Shift Imaging (CSI) sequence. Given the short life time of hyperpolarized signals, one of the main challenges of this 13C metabolic imaging and spectroscopy remains the optimization of Signal-to-Noise Ratio (SNR) and of image quality. These methodologies are used to explore -time functional MRSI of skeletal muscle metabolism, of cancerous growths and of developing placentas.
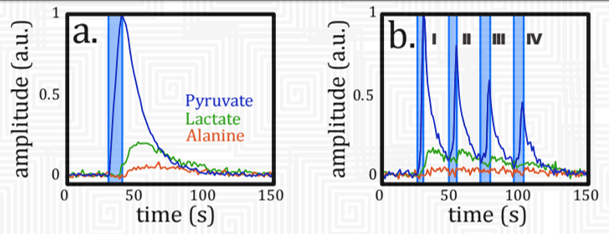
Real-time functional 13C MRSI of skeletal muscle metabolism during an exercise-mimicking nerve stimulation. This scheme shows the dynamics of 13C-pyruvate metabolic conversion into 13C-lactate and 13C-alanine in the mouse hind limb muscle. (a) shows a single bolus event whereas (b) shows experimental demonstration of 4 bolus events (I-IV) with interbolus separation of ca. 30s.
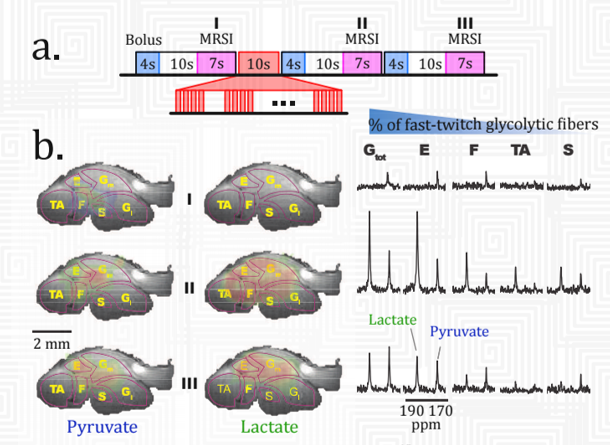
Hyperpolarized fMRSI of muscular activation. (a) Multiple-bolus delivery scheme interleaving MRSI acquisitions with off-on-off stimulation paradigms. Control (I), stimulation (II) and post-stimulation (III) epochs were initiated by 133 mL/bolus/4 s injections of 60 mM 13C-pyruvate delivered 27 s apart. Stimulation consisted of 10 s strings of 10 V pulse-trains applied with a 10 Hz frequency, and with each train consisting of trains of 200 ms pulses. (b) 13C quantification maps collected for pyruvate and lactate with a 0.78 mm60.78 mm in plane resolution on a 2 mm thick slice, overlaid with anatomical 1H MR images obtained with a 0.1 mm isotropic resolution. Indicated in the anatomical reference images are regions assigned to various muscle groups (see text for definitions). (c) Summed 13C spectra from each region of interest corresponding to the indicated muscle groups (Gtot, total gastrocnemius), arranged as a function of decreasing percentage of fast-twitch glycolytic fibers.