Most stars of >8 Mʘ end their lives in supernova explosions, which create and distribute the majority of the heavy elements. The explosion mechanisms are a subject of vigorous research. Theoretical models begin with initial conditions – the assumed structure of a model star – and attempt to predict the properties of the resulting explosion. Progress thus requires assembly of a data set connecting observations of pre-explosion stars with measured explosion properties. Such observational constraints are critical, but exceedingly scarce – few SNe have an identified progenitor visible in pre-explosion imaging, and few more are likely to be found in the foreseeable future, due to the low rate of such events in very nearby galaxies where individual stars can be observed. Charting the fate of the diverse populations of massive stars to specific explosive outcomes is important in order to elucidate the feedback of massive stars on their gaseous environments, and their role in galaxy evolution.
Early emission from supernovae
Dramatic advances will be made by early-time observations of SNe during the shock breakout, occurring when the first photons diffuse ahead of the explosion shock, and the shock cooling phases that follow.
The duration of shock breakout flares is 10 s to 1 hr, depending on the stellar radius, R*. Though theoretical details of the shock breakout flares at very early times (<1 hr) are still debated (see Figure 1 of Ganot et al. 2016, ApJ, 820, 57), the UV shock-breakout emission must match smoothly to the well-understood, and observed subsequent shock-cooling phase. The high temperature of the breakout and shock-cooling implies that the UV and optical bands are in the Rayleigh-Jeans regime. The decrease in flux due to falling temperature is nearly offset by radius expansion. Thus, for large (supergiant) progenitors the ratio of breakout to shock cooling flux is close to unity at a few hours.
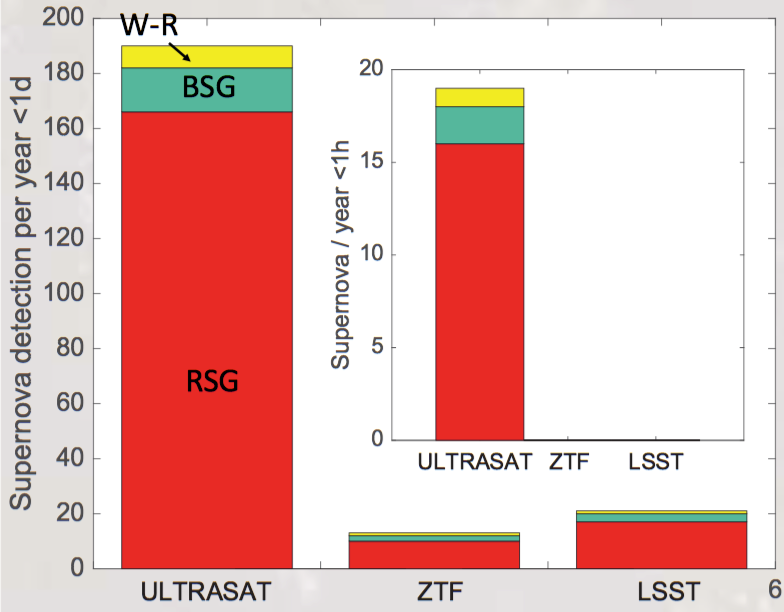
Detection of shock-breakout flares provides a direct measure of the pre-explosion stellar radius, R* (the duration scales as R*/c and the integrated luminosity as R*2 ). ULTRASAT is expected to detect about 15 flares per year (Ganot et al. 2016, ApJ, 820, 57; see Figure 1 below).
Shock breakout is followed by a cooling phase that lasts from an hour to a few days, during which the expanding stellar envelope emits the stored explosion energy. Cooling light curve models have been verified by a few serendipitous UV detections (e.g. Rabinak Waxman 2011, ApJ, 728, 63; Ganot et al. 2016, ApJ, 820, 57; Rubin & Gal- Yam 2017, ApJ, 848, 8; Ganot et al. 2020, arXiv:201112261).
Early UV observations are key
The shock cooling stage of the SN evolution has imprinted on it information on the stellar radius, as well as on the composition of the stellar envelope and energy of the explosion. Clean and simple physics govern this stage, allowing derivation of progenitor and explosion parameters from the rise to, and fall from, the flux peak (e.g., Rabinak and Waxman 2011, ApJ, 728, 63; Ganot et al. 2016, ApJ, 820, 57; Rubin & Gal-Yam 2017, ApJ, 848, 8; Soumagnac et al. 2020, ApJ, 902, 6; Figure 2 below). The route from light-curves to progenitor measurements is described in detail in these references. The pronounced UV peak, which occurs when the emission temperature passes through the UV band (Fig.2), allows one to robustly measure R* to ~20% accuracy (Rubin & Gal-Yam 2017). Lightcurves in the UV and a single optical band will measure the extinction, and determine explosion energy per unit mass (E/M) to ~30% (Fig.2).
Since Tλ does not drop significantly below the recombination temperature, ~0.8eV for H and ~1eV for He, observations at λ > 3000 Å do not put accurate constraints on progenitor properties. In the optical (including u band; Rubin & Gal-Yam 2017) the peak occurs later, and is governed by the unknown inner structure of the progenitor and by complex additional physics, such as recombination and radioactivity. This makes parameter extraction from optical data alone not reliable.
In the X-ray band, only few stars (intermediate-size blue super-giants) will be detectable. Larger red super- giants emit mostly in the unobservable EUV range while compact Wolf-Rayet stars have small radii that lead to weak and difficult-to-detect X-ray emission. Thus, X-ray observations sample a narrow range of progenitor stars that do not map the full population.
Early NUV SN observations will achieve the following four objectives:
01
Measure progenitor properties
High-cadence NUV observations of the shock cooling phase provide a direct determination of R*, as well as constraints on the progenitor surface composition (H, He, or C/O; Fig.2). Detection of the initial shock breakout flare will provide an independent measure of R* for a subset of events. These data will set initial conditions for explosion models.
02
Measure explosion parameters
The NUV light curves combined with ground-based photometry can determine the extinction towards the SN and E/M of the exploding ejecta (Fig 2). NUV observations will also robustly determine the bolometric rising light curves of possibly jet-driven Type Ib/c events (~10 per year expected), mapping outward radioactive 56Ni mixing driven by failed jets or large-scale turbulence.
03
Map progenitors to resulting SN Types
The measurements of R*, the surface composition, and E/M for a wide range of progenitor and SN types (Ganot et al. 2016) will provide modelers with a benchmark set of SNe for which both the pre-explosion stellar state and the explosive result (SN Type) are well-defined. The ULTRASAT sample will be large enough that it will include rare Type IIb and Type Ic-BL events (4-5% of the total sample). These are important because they hold the key to fundamental issues: how stars transition between supergiant and compact states prior to explosions (Type IIb), and what the connection is between normal SN events and relativistic Gamma-Ray Burst (GRB) explosions (Type Ic-BL).
04
Reveal pre-explosion evolution and mass loss
When considerable pre-explosion mass loss occurs the shock breakout takes place in the circumstellar matter (CSM). The NUV light curves of CSM breakout events can be used to measure the CSM density profile and total mass. ULTRASAT is predicted to find >30 of these less common but luminous events per year. Evidence for outer-envelope mixing and pre-explosion mass loss in massive stars would support theories suggesting large scale convective instabilities are important.
What about extinction?
NUV and ground-based optical observations of the smooth spectral form of early SN emission will determine not only the amount of extinction for each event (Fig.2) but also the extinction curve. The impact of extinction on the expected event rates has been empirically determined by our PTF-GALEX pilot project (Ganot et al. 2016) and is accounted for in the rate estimates (Fig.1).
What about host-galaxy background?
We measured the impact of host galaxy UV emission on our detection rates using a large sample of PTF SNe with GALEX UV host observations (Ganot et al. 2016, ApJ 820, 57), adjusted for the ULTRASAT transmission curve. The effect is negligible compared to other backgrounds, and accounted for in rate estimates.
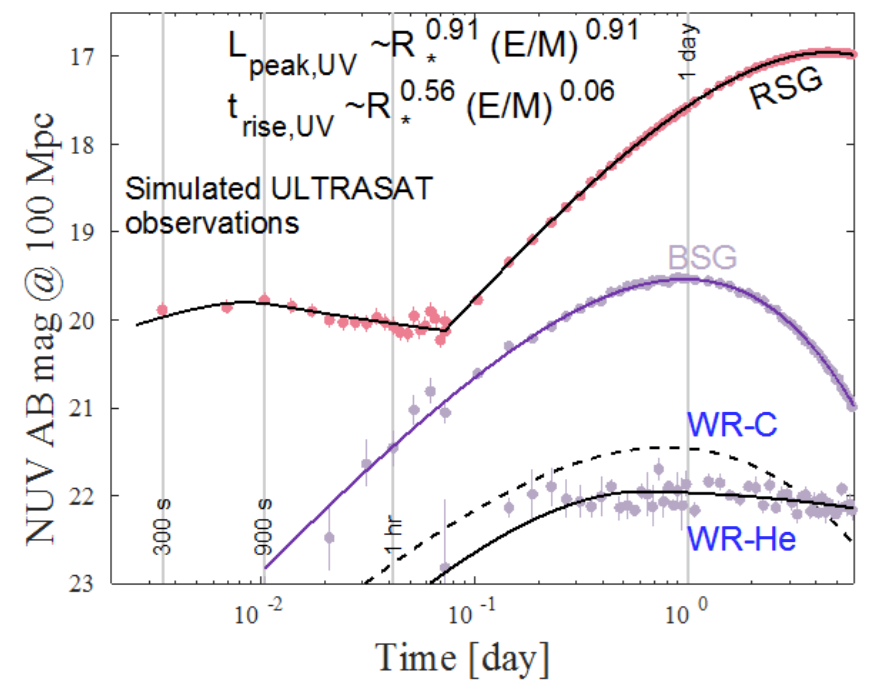
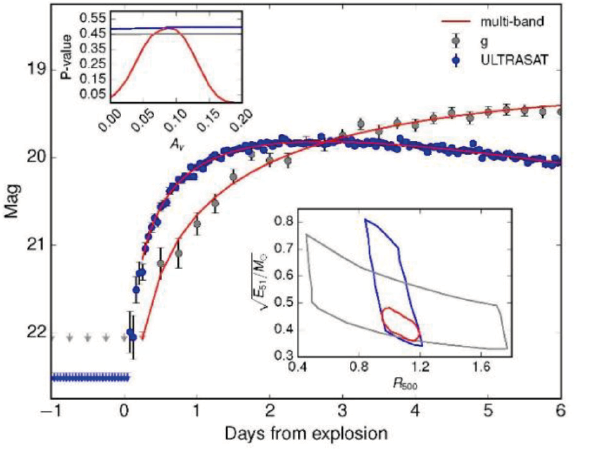
Figure 2. Left: Early UV observations clearly differentiate progenitor stars by radius (red super-giant [RSG], blue super-giant [BSG], W-R star) but are also sensitive to the surface composition of W-R stars (bottom curves). Right: Model NUV light curves (shock-cooling only, no breakout) and simulated data points (blue) and ground-based g-band (grey) for an RSG explosion at 250 Mpc, with R*=500 Rʘ, E/M=2x1050 erg/Mʘ and AV=0.1. Lower inset- R* and E/M inferred from observations (95% CL, blue – UV alone, grey – g alone, red - combined); Upper inset – The extinction inferred from observations.