Differential magneto-optical technique
In order to improve the sensitivity of the MO technique we have developed a differential method. The applied magnetic field and temperature are initially fixed at some value and a first set of images is acquired and averaged. The magnetic field or temperature is then increased by a very small amount and another set of images is taken and averaged.
We then subtract the first image from the second one and obtain the resulting differential image. This process is repeated typically 100 times and averaged in order to increase the signal to noise ratio. By this method we are able to improve the field resolution by more than two orders of magnitude down to about 30 mG.
By recording the differential images at a sequence of fields or temperatures a movie of the melting process is obtained. Note that the resulting differential images do not show the magnetic field distribution but rather the local variations in the field due to the external modulation of the applied field or temperature.

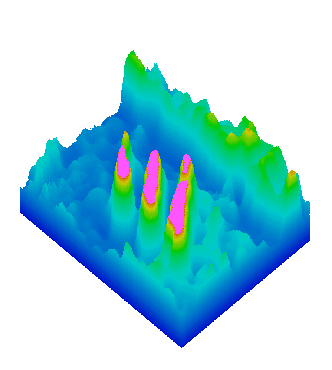
An example of a differential image of the local variations in magnetic field due to the external modulation of the applied field or temperature.
Vortex melting observation with differential MO
The differential MO technique is applied to the investigation of the vortex-lattice melting transition in HTS. At the melting transition the solid vortex-lattice transforms into a fluid phase of vortex line liquid or gas of vortex pancakes. Due to the first-order nature of the transition, the density of the vortices changes discontinuously at the transition. Since each vortex carries one quantum of magnetic flux, the discontinuous change in the particle density translates into a step in the local magnetic field B.

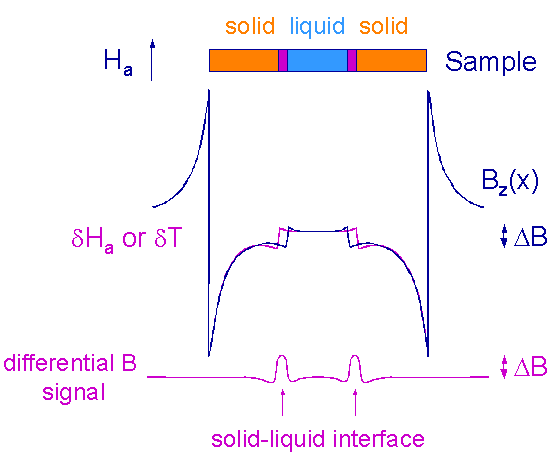
Magnetic field (top) and differential measurement (bottom) along the sample, showing the transition between the solid and the liquid phase.
This figure demonstrates how the vortex-lattice melting transition can be observed using the differential MO technique. In a pure case with no disorder the melting transition should propagate as following. In platelet samples in perpendicular applied field, the internal equilibrium magnetic field within the sample has a dome-shaped profile with a maximum in the center. As a result, as the field or temperature is increased, a vortex liquid droplet should be formed in the center of the sample, surrounded by a vortex solid. Since the transition is of a first-order, the field B in the liquid phase is larger by ΔB than in the solid (blue profile).
The height of this step ΔB is typically a fraction of a Gauss, which is too small to be resolved by a conventional MO technique. In our configuration, the small field or temperature modulation causes periodic motion of the solid-liquid interface (magenta profile). The difference between the magenta and the blue curves is the differential signal, which has sharp peaks at the location of the solid-liquid interface. In a top view of the sample, a bright ring should therefore be seen, which surrounds the vortex liquid droplet and separates it from the surrounding vortex solid. The height of this ring is ΔB whereas the local width of the ring reflects by how much does the interface move in response to the field or temperature modulation.
In real samples, however, we find that the melting process is much more complicated and it is dominated by the disorder-induced distribution of the local melting temperatures. The equilibrium dome-shaped field profile is therefore only of a secondary importance and it merely delays the melting process near the edges.
Additional information
- Imaging the vortex-lattice melting process in the presence of disorder
A. Soibel, E. Zeldov, M. Rappaport, Y. Myasoedov, T. Tamegai, S. Ooi, M. Konczykowski, and V. B. Geshkenbein
Nature 406, pp. 282-287 (2000).


