
The outside world bombards our senses with constant input. This information is encoded into neuronal electrical activity that is processed, integrated and transferred between different brain areas. Experimentally tracking such processes in intact brains is experimentally difficult due to the overwhelming number of neurons and the complexity of their connections. We have developed novel experimental methods allowing us to pattern and manipulate one dimensional cultures on glass [see figures 1,3]. Activity, analogous to "sensory" input is induced on one end of the line and travels along it as neurons excite their neighbors. The structure of this network allows us to track (using fluorescent Calcium imaging [5]) as well as affect (by use of the picoliter fountain pen [4]) the signal at any point along its path. In this way we measure signal velocities as well as quantify rate coded "sensory" information as it is processed. This technology has also proved useful in the study of spontaneous pacemakers [5,6] and in the creation of instruments made of live neurons rather than wires and resistors [2]. Beyond that, the simplification of having neurons connect along a line allowed us to theoretically relate the properties of single neurons to qualities that emerge in the neural network. Such understandings are valuable when interpreting our results back to the original brain processes.
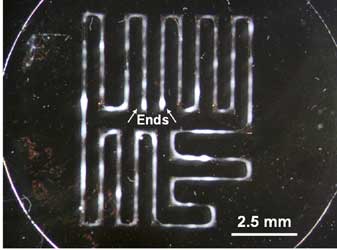
1. An 8 cm long 170 micron thick linear culture, containing about 25,000 neurons. Signals propagate the whole distance.
2. A neuronal "AND" gate. The output is connected by thin connections to the two inputs.
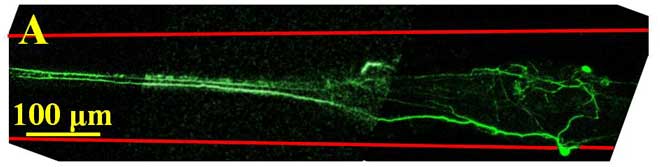
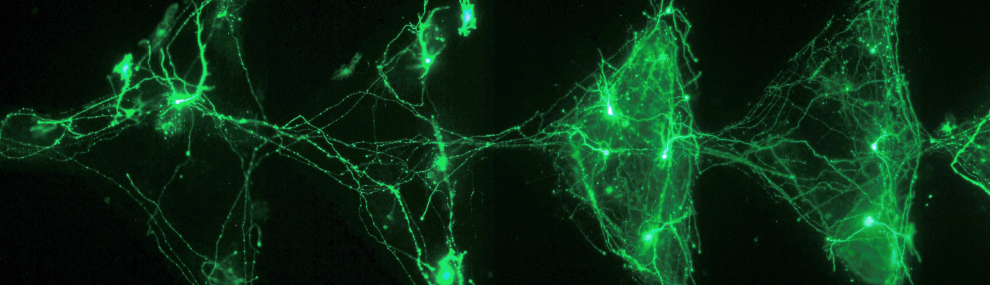
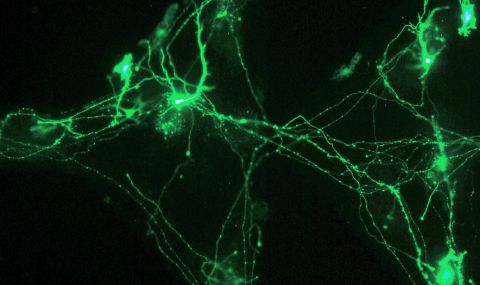
3. Two GFP colored cells on a 170 micron thick pattern. Axons grow parallel to pattern and reach maximal distances of about 1 mm.
4. The Picoliter 'fountain-pen' composed of two concentric pipettes during 10Hz oscillatory perfusion (movie slowed down).
5. Spontaneous activity on two ends and central parts of a 2cm line (see 6.A+B), the part of the culture to the right is a disconnected control. Note the differences in activation times of the three patches during the two events.

6. A. a diagram of a 2cm line. The red circle represents the microscope field of view. B. A fluorescent image of the two ends and central part of the line. C. An event elicited at one end of the line takes 100 msec to reach the central part of the line and another 100 msec to reach the opposite end (for other time signatures see 5).
Signal propagation along unidimensional neuronal networks
Feinerman O., Segal M. & Moses E. (2005) Journal of Neurophysiology. 94, 5, p. 3406-3416
PDF
A picoliter 'fountain-pen' using co-axial dual pipettes
Feinerman O. & Moses E. (2003) Journal of Neuroscience Methods. 127, 1, p. 75-84
PDF