
Strong magnetic pulses have been used routinely for over 20 years in Transcranial Magnetic Stimulation (TMS) to stimulate neurons in the cortex, yielding both clinical benefits and insight into activity of the brain. However, the ability of a magnetic field to affect neuronal cultures in-vitro has never been reported, despite its obvious relevance.
Theoretically, the main requirements for excitation of neuronal cultures are directionality of the axons along the lines of the induced electric field and a large enough size of the culture. We construct such a culture by utilizing a one-dimensional preparation in which neurons (and axons) are aligned along a ring. This is effectively a neuronal 'induction ring'. For large enough radii we demonstrate the reliable stimulation of cortical and hippocampal neurons with both home-made and commercially available magnetic stimulators.
The physical size of the culture and the directionality of axons are necessary but not sufficient for magnetic stimulation. 2D cultures do not respond because not enough neurons are directed along the electric field and small cultures do not respond because the electric field decreases proportional to the radius.
The excitation depends on single neuron characteristics, including both electrophysiological and geometric requirements. It turns out that only a small subset of initiating neurons fulfills these demands. Therefore cultures with small populations do not respond because not enough neurons are excited by the magnetic pulse. We conjecture that the relevant single neuron characteristics are related with membrane rise time, axonal length constant and axonal geometry.
The same single neuron properties may also dominate the sensitivity of neurons in-vivo so further exploration of these properties may prove crucial for our understanding of TMS. Magnetic stimulation in-vitro can be explored efficiently and without technical and safety limitations set by TMS. Neuronal orientation, myelin content, culture size, culture geometry, culture connectivity, pharmacology and stimulation frequency are all crucial for accurate implementation of TMS and can now be accessed in-vitro. This can have a profound impact on how people conduct research and therapy with TMS.

Modeling TMS of one-dimensional neural cultures
A) A circular coil (blue circles) is positioned 5 mm above one-dimensional neuronal ring cultures (blue disc). The coil creates a pulse of magnetic field which is oriented along the red lines. By Faraday's law the induced electric field lies on planes that are parallel to the plane of the coil, along rings concentric with the coil and depends on the change of magnetic flux through these rings. B) A close up of the horizontal cross-section along the plane of the ring cultures in A. The relative value of the electric field is color coded, and its direction depicted by white arrows. Larger rings enclose a larger area of flux and therefore the electric field induced at those rings is stronger. C) The membrane potential of a neurite that is 0.2 mm long (green) compared to that of a neurite 6 mm long (blue). Both neurites have a length constant of λ = 0.3 mm. The membrane potential of neurites that are shorter than their length constant is simply linear with their length, while membrane potential of neurites that are longer than λ is governed by λ (the passive time constant is t τ=1ms).
The effect of size on magnetic induction. Two copper rings are placed concentrically over a “figure of eight” magnetic coil. Both rings interact with the magnetic pulse but the larger ring jumps higher because of the larger amount of magnetic flux that it encloses.
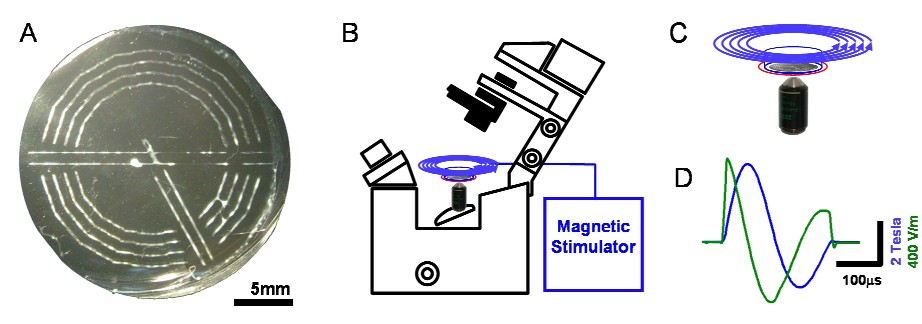
Experimental setup
A) A bright field image of a patterned 24 mm coverslip. The white areas are neuronal cultures. The photographed pattern consists of ring cultures in arcs of different length. Radial lines serve as a control. Each ring’s thickness is ~ 200 μm. B,C) An inverted microscope images fluorescent dyes sensitive to calcium transients of neurons reacting to magnetic pulses. The magnetic coil (blue circles) is located 5 mm concentrically above the neuronal ring culture, which is placed in a Petri dish (blue outline). A pick-up coil (red circle) positioned on the circumference of the Petri dish measures the voltage induced by the magnetic pulse. D) The measured dynamics of the Magnetic Stimulator coil (MS capacitor voltage load = 5000 kV) as integrated from the pick-up coil illustrated in B. Induced Electric Field (calculated for a ring radius of 14 mm) is depicted in green while the magnetic field is depicted in blue.
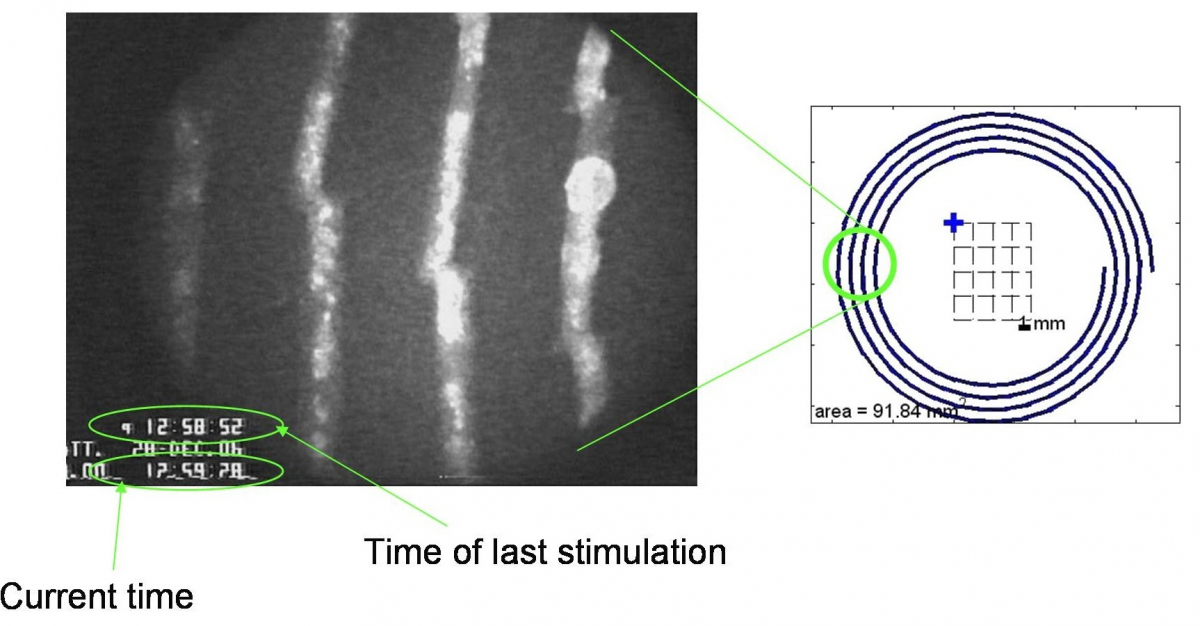
Imaging Neural response to TMS
A spiral shaped culture was stimulated with TMS. The time of last stimulation is marked in the video, as well as the real time. Note the spontaneous activity circling around the spiral, as well as the evoked activity, which is intitiated in a different region.
Fluorescent measurements of calcium transients
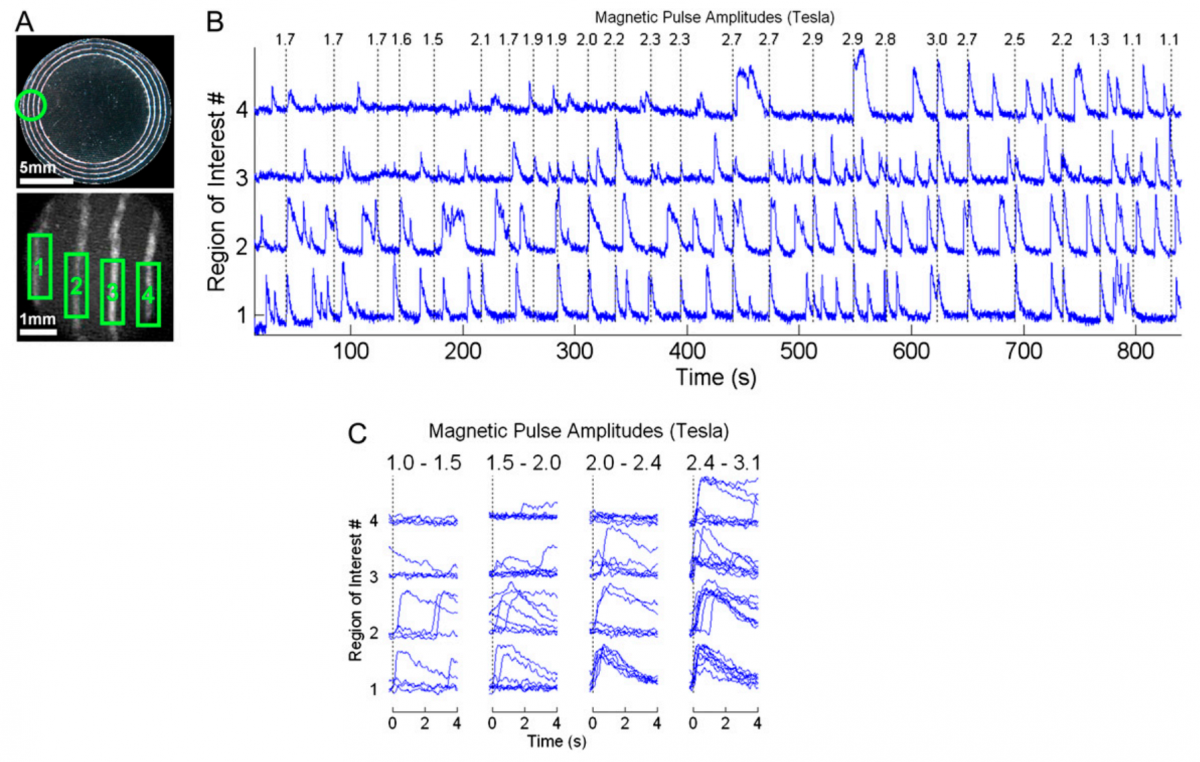
A) Top: Image taken with a low-magnification stereoscope of a 30mm coverslip containing 4 concentric ring cultures (14, 13, 12 and 11 mm in radius) that were imaged during magnetic stimulation. The field of view of the high-magnification imaging microscope is marked with a green circle. Bottom: A single fluorescence image from the field of view of the imaging microscope. Numbered boxes denote the regions of interest for which the average intensity in B is displayed. B) The DF/F (i.e. the ratio between transient and background fluorescence) intensities of each blue region in A is plotted vs. time (blue traces, each trace was normalized according to its maximum amplitude, which was ~5% DF/F in all regions). The exact timing of each of the TMS pulses is marked with a dashed vertical black line and the amplitude of the magnetic pulse in Tesla is denoted above each line. Both spontaneous activity and evoked activity is observed. C) The responses of each region to TMS, clustered according to the strength of the stimulation. Each trace is taken from B during the 4 s that follow each stimulation. As illustrated in figure 5A, ring cultures with larger radius (regions #1 and #2) respond to weaker stimulations and vice versa. The measured Magnetic Field Threshold in this case is 1.3 T for regions #1 and #2, 1.7 T for region #3 and 2.7 T for region #4.
Single Neuron response
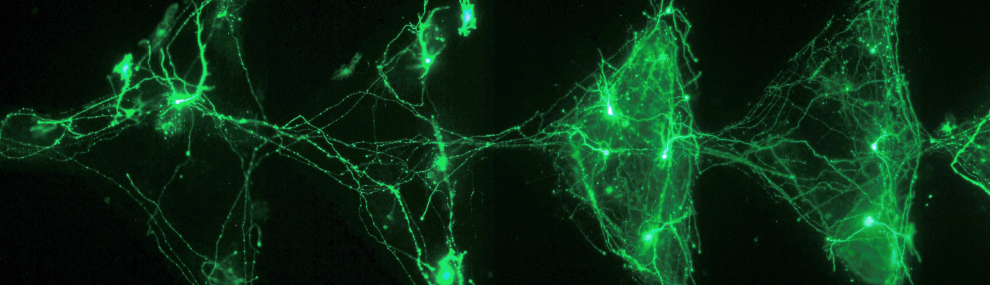
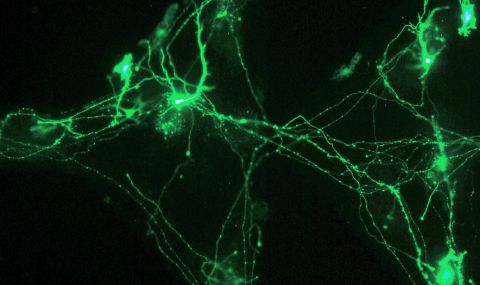
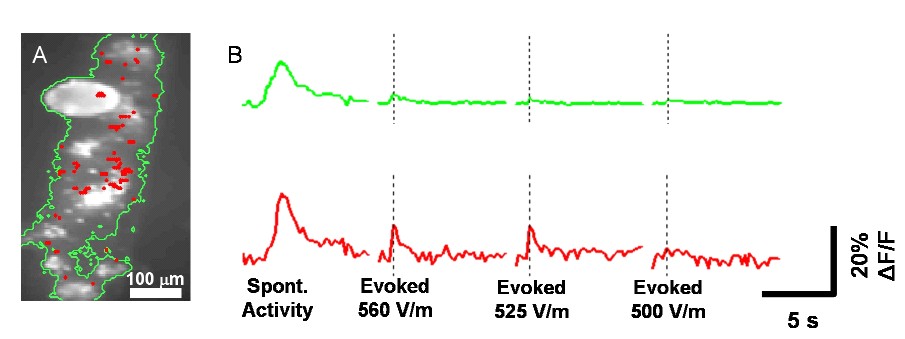
A) Fluorescent analysis of video taken from a 10 X field of view. The image is the average intensity of the fluorescent signal across 4 events of 450 frames each. Green contour encloses areas that were spontaneously active during the first event (at 4.5 mM of CNQX, the highest concentration at which spontaneous bursting activity persisted across the whole culture). Red points represent locations that responded to TMS during the last three events (at CNQX concentration of 9 mM, for which no bursting activity was observed). B) Traces of the fluorescence signal (in units of the relative change of intensity as a fraction of the background intensity) during the four events: black traces (top row) average intensity of all coordinates enclosed in the black contour and red traces (bottom row) average intensity of all red coordinates. TMS pulses are marked with a dashed vertical line, with the intensity of the induced electric field indicated in V / m.
Magnetic stimulation of one-dimensional neuronal cultures
Rotem A. & Moses E. (2008) Biophysical Journal. 94, 12, p. 5065-5078
PDF