
The combination of Transcranial Magnetic Stimulation (TMS) and electroencephalography (EEG) has been demonstrated to be an exciting tool to study changes in effective corticocortical connectivity induced by different states of consciousness. However, the large artifact that the TMS generates in the EEG, necessitates a sophisticated artifact-resistant EEG system to acquire reliable signals in the crucial several tens of milliseconds immediately following the TMS pulse. We demonstrated the use of a novel artifact removal algorithm together with a 24 bit EEG system to achieve similar recordings as those obtained with the dedicated TMS-compatible EEG system (see figure 1 - upper panel: before artifact removal, lower panel: after artifact removal). Using this setup we observe differences in TMS evoked responses between a group of healthy controls and a group of patients with Schizophrenia, a condition in which effective neural connectivity is thought to be compromised (see Figure 2). This demonstrates the potential of using TMS-EEG as a powerful tool to validate theories of dysconnection in Schizophrenia and paves the way for a larger group of researchers and clinicians to use TMS in combination with EEG for research and diagnosis of a wide spectrum of disorders of consciousness.
This project was done in collaboration with Dr. Vladimir Litvak
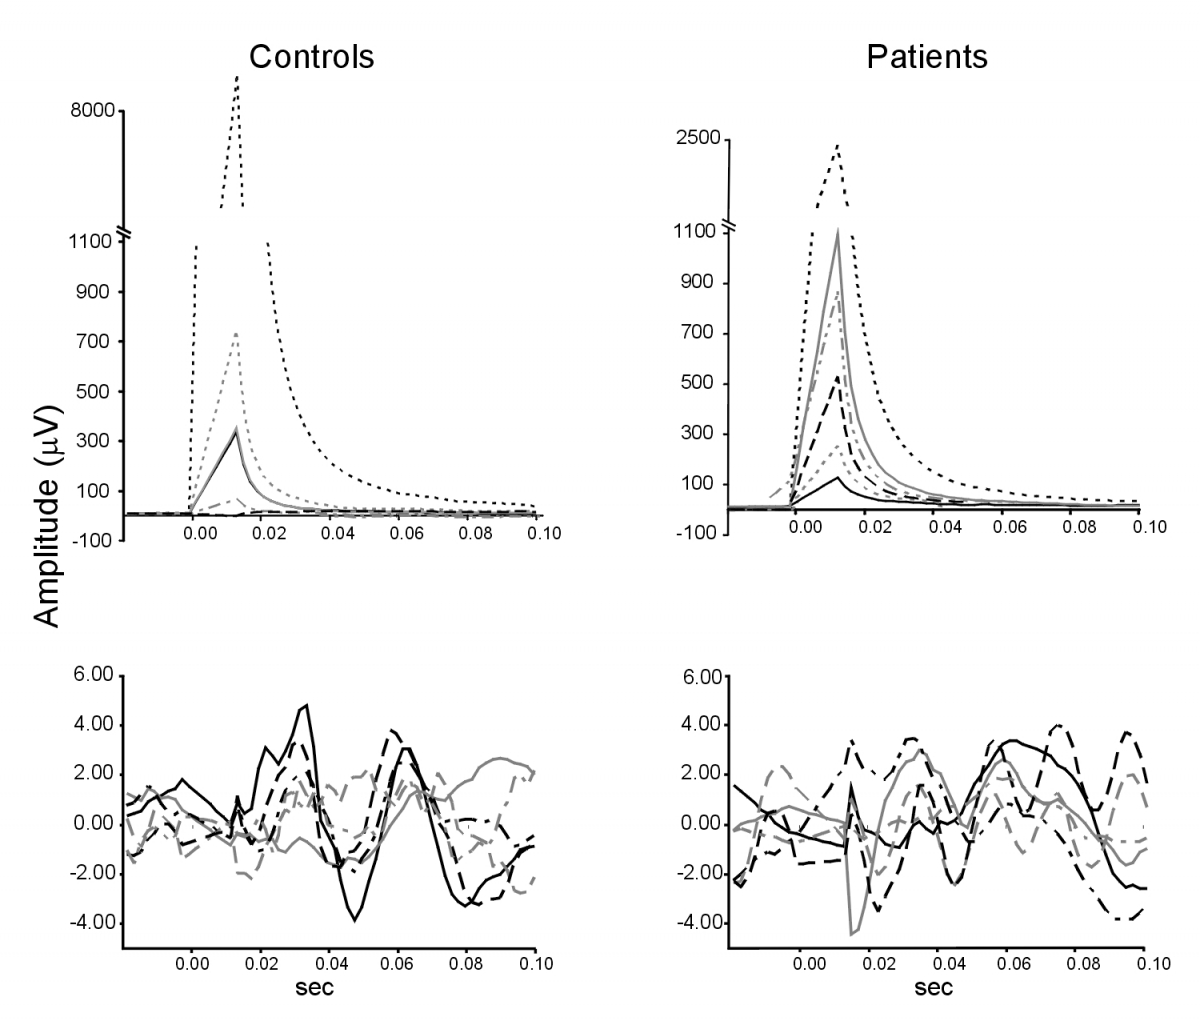
Figure 1. TMS evoked potential waveforms in the CPz electrode. Left panels are for controls while right panels are for patients with Schizophrenia. Upper panels: Before artifact correction. Lower panels: after artifact correction. Even after removing the initial part of the artifact by interpolation the residual artifact amplitude exceeded the physiological signal amplitude by three orders of magnitude. Nevertheless, the residual artifact could be corrected using the method of Berg and Scherg (1994). After artifact correction clear activity peaks could be seen in most subjects.
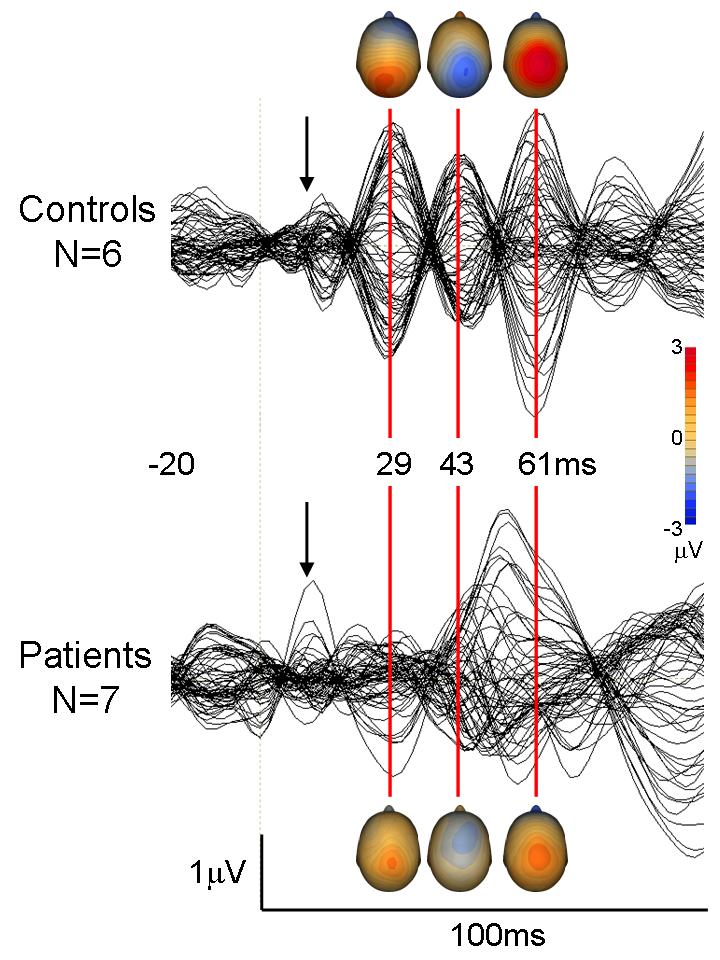
Figure 2. Grand averages of responses. Displayed are the grand averages of responses to effective stimulation separately for healthy controls and patients and scalp maps of potential distribution at the peaks of the responses seen in healthy controls. It can be seen that the clearly circumscribed peaks seen in healthy controls around 29, 43 and 59 ms after the stimulus are reduced in amplitude and smeared in time in patients. In healthy controls at 29ms after the stimulus clear frontal negativity and parietal negativity are observed. In patients the frontal negativity is absent (as can be also seen in Fig. 17B) and the parietal positivity is greatly reduced in amplitude. In addition, the negativity around 43ms after the stimulus is shifted frontally and the centro-parietal positivity around 59 ms is greatly reduced in amplitude.